
Natural Gas Day Trading
Natural Gas Day Trading NG 08-13

day trading natural gas
NG 1440min Chart
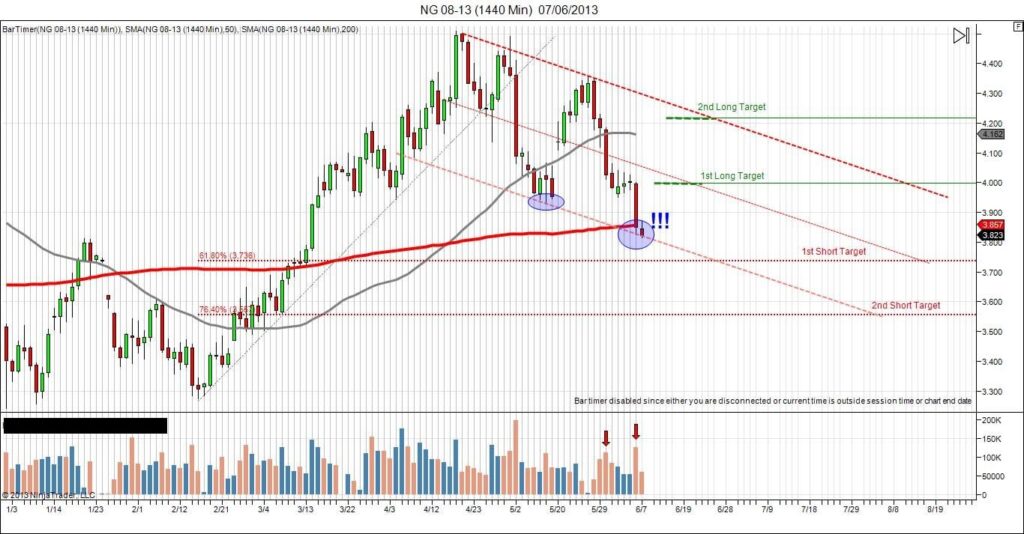
Last week, after small consolidation, Natural Gas drop and break last double bottom, at 3.930 & the 200MA. More important, sellers close under the 200MA by the end of the week.
Sellers Volume was stronger than last one and twice than buyers.
Next day will be decisive to know if NG price will keep dropping, or buyers will get back in market.
Few important thing to notice: my lower “light-Pink” is only a potential resistance line. If buyers will be back at this level, then this trend line will be important. For the Bearish Channel.
!!! : this is to show you why I’m more likely to be short on this trade. After passing the 200MA, buyers retest the following day. But by the end of the day, it finish at sellers price.We also go lower than last candlestick low. If Monday sellers start to break last Candlestick low again, I’m expecting to see another big spike of volume. And we should go till 3.600 easily.


Comments
No comment yet.