

Day Trading S&P500
Day Trading S&P500 , on this post I will use my past chart with same, trend line, and ES E-mini Futures to show you few thing.

day trading sp500
^SP500 Weekly Chart
Last week, Sellers test 1600 area. Sellers did not pass this level, but is normal. Is never easy to pass a psychological level/resistance. We also finish with a Unsupported price from sellers and price was closed at Buyers price.
If I look on weekly chart, this look more like we will go Long and retest last highs.
But if we look on Daily chart / ES 1440 min chart, we can see why this can be a trap for those who are looking to go Long on SP500.

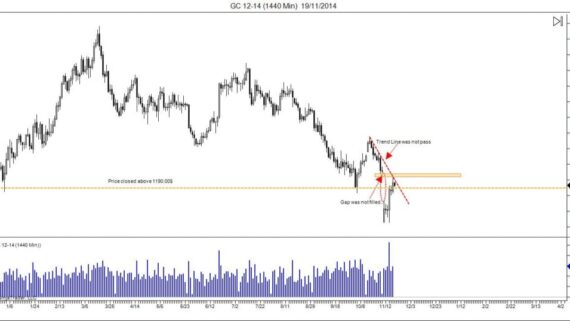
day trading ES
ES 1440min Chart
On daily chart, we can see following thing:
-Volume, buyers was strong as sellers, but fail to make a Double Top by 1.75pt.
-Look like we are going in a Bearish movement
-We make a 50% Fibonacci ret.
-Sellers Pass 50MA and 1600points. Finish with an unsupported price. It shows Sellers commitment to take control of SP500
So far is not clear for me witch way market will go. I’m looking to get a signal on Monday.
For ES Long next Targets: 1553.00 – 1572.00 – 1565 – 1684
For ES Short Next Targets: Retest 1600 Area and close under red area…once it donne, next target will be at 1575pt


Comments
No comment yet.