
Market For January, Look interesting to me
Market With New All time High
2 trading days left, before the Monthly candlestick End. Depending how market will be re-act, and especially at what price it will close. We may see a nice short signal for month of January. I will use GS ( Goldman Sachs) and SPY (ETF: S&P500) to demonstrate what I’m waiting for. There’s also, a quick paragraph about TD( Toronto Dominion bank), time to time I like to watch this stocks, and it look to me, we may see a short Direction soon.
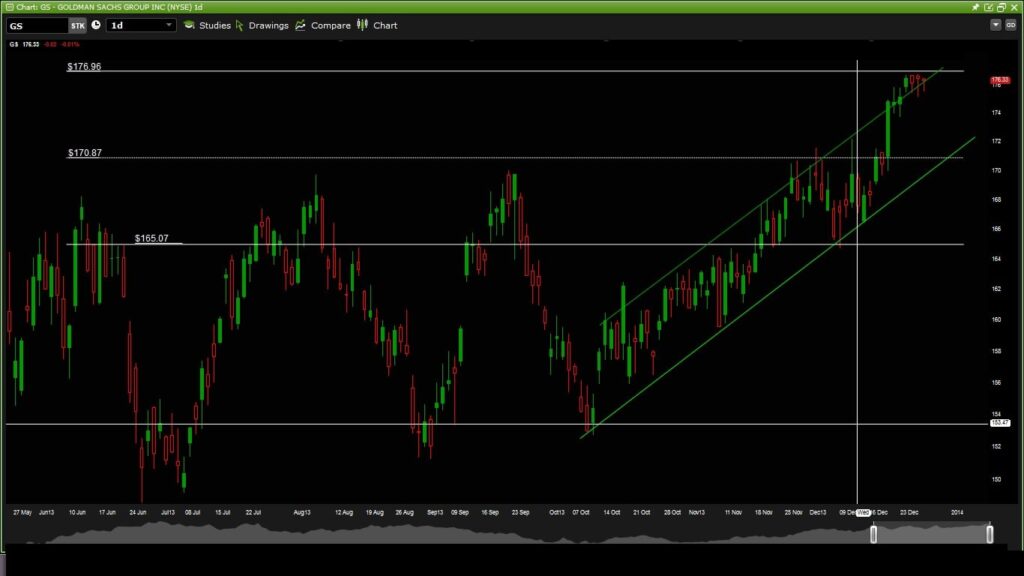
Goldman Sachs Daily
Goldman Sachs Daily Chart
After Breaking the Double Tops at 169$. We saw a very clear break out, that Normally should give us a :Long Direction for next days and weeks.
The usual pattern, after Breaking Double tops, is to go back at those price again. Bounce and keep moving UP.
Unfortunately if this happen, I don’t think Market would have enough time (2 days), to go down bounce and Move Up again, to keep the direction.

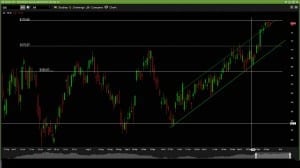
SPY chart
This is SPY chart, an ETF that represent S&P500
On this chart, I draw what I was saying in past paragraph.
The important thing to notice, if SPY drop to 171.0$ , or about, we would get a “doji” for December. This would be a nice signal for shorting January.
If we go below 171.0$, that would even be a stronger signal. And I would say, it will represent a “traps” for those who bought those stocks last week.
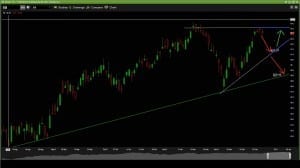
td chart
TD Daily Chart
With missing last tops, and seeing Sellers volume increase, that would be a very nice short trade.
2 thing, to keep watching for this stock. We may go directly to 88$, or fall in a “pennant”. What would be also, a nice trade short or long to take , on a break out.
Comments
No comment yet.