
Day Trading Bonds & Stocks TMF symbole
Day Trading Bonds & Stocks TMF symbol: Hi traders! Happy New Year! and wish you all the best for 2014!
For this year, I decide to increase my skills in stock market, is why for next blogs and video, I will show charts from Futures Market, and a chart with a “Sock Market Symbol”. For this blog, I will use a TMF ,3x Bearish bonds stock Symbol.

day trading bonds weekly chart
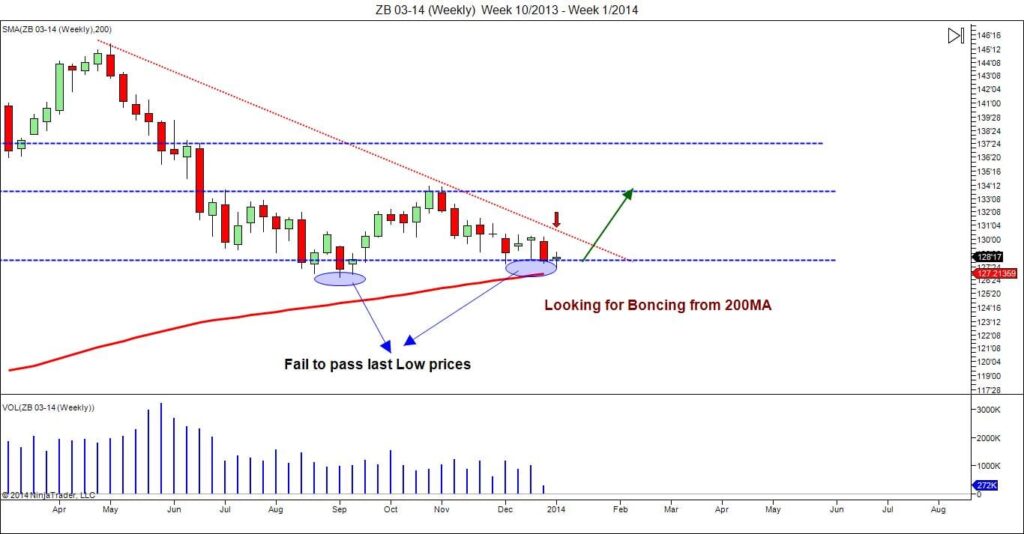
Bonds “ZB futures” Weekly Chart:
On weekly chart, you can see, we have few resistance on sellers side.
-200MA ( Srong Resistance for Sellers to pass)
-Sellers Fail to go to last Lowest price
-And volume are not that impressive

day trading bonds
Futures ZB Daily Chart
-On thing why I’m long on “ZB futures Instrument”, is because why I saw on weekly chart, is also happening on Daily chart. What I mean by this? well, sellers fail to go to last lowest price on daily chart. And they are losing momentum on last move down.
-With a nice signal of “Doji” , it look like Monday can be a turning point. First thing Buyers need to test, it;s to break Bearish trend. Once it done, 200MA are buyers target to hit.

Stocks market TMF 3xBear
Stocks Market ETF: TMF 3x Bear
Since many people are also trading Stock market, I decide for this year to get some skills in this market also. My targets will probably not be as precise as on Futures Market at first. But looking after few weeks to get same results.
And will be happy to know you that you will be able to make money on stocks market also, following my blogs 🙂
-The chart of TMF , are almost similar, is why won’t start to comment about.
Happy Trading Week everyone!
Will post videos on next week,


Comments
No comment yet.