
US Dollar Day Trading
US Dollar Day Trading ,Using DX E-mini Futures Contract

US$ day trading
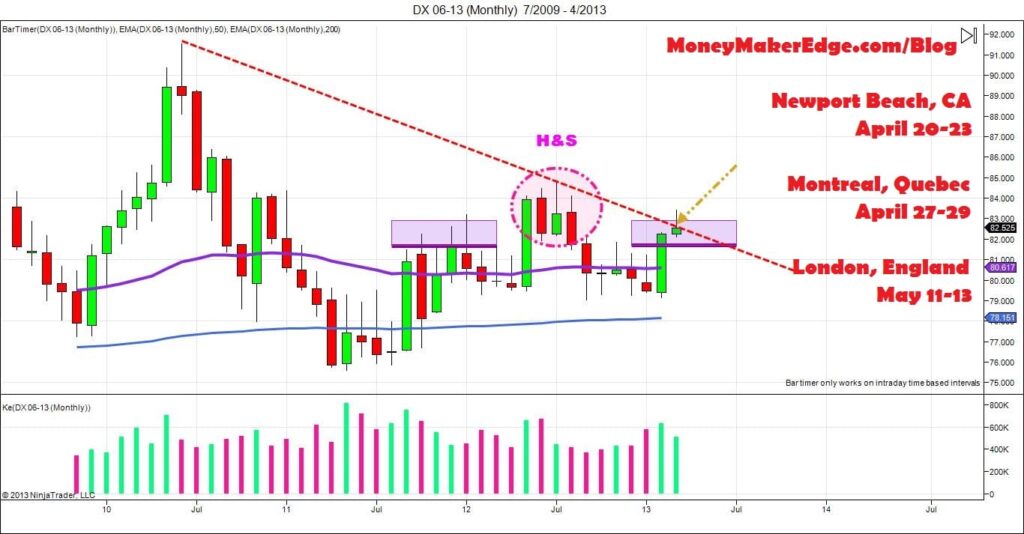
US Dollar Day Trading Monthly H&S:
We can clearly see H&S pattern Monthly chart. Personally I don’t like this short trade for few reason. Volume, buyers Pushing price higher than Left Shoulders. And on daily and weekly chart, we can see buyers trying to close above Red Trend Line.
For those who are willing to take this trade. Long Term target will be MA 50, 79.80 and 200MA on monthly chart. Wait for the end of this month, before thinking to take a trade short on DX, few index will probably give us a direction for next weeks.

US dollar day trading
US Dollar Day Trading Weekly H&S zones:
ZONE1 : At first movement buyers start strong and close above 50/200MA. This way, buyers will have great support for long term. And actually it did.
ZONE2: After taking a rest on 200/50MA, Buyers get once again in the market with more commitment to close at higher price. unfortunately they wasn’t able to keep this strong commitment at all, and sellers just crash Buyers price, under 200/50MA.
ZONE3 : After toff fight at who will control 200/50MA area, Buyers finally take control and make one more movement UP. They was able to keep strong commitment for long time. till they reach the red trend line. and four few days close above.
VOLUME: if we look at all 3 zone, buyers get stronger every time, but sellers keep almost same commitment and have hard time to keep or push price under 50/200MA.
US Dollar Day trading : if you agree with me, and prefer to wait to take Long trade in futures days, Wait to see how sellers and buyers will react at 81.5 and 81.10 price.


Comments
No comment yet.