
S&P 500 Can These New Highs Continue?
In the past number of months since the US election we have seen the S&P push new highs a number of times. Even as I write this the S&P is pushing new highs with price currently at the new all time high of 2326.00. In thinking about where the coming days and weeks could take the S&P, I opened some new weekly charts. I started looking at where this could take us and here is what I see right now.
Price is currently in an area of resistance, approaching a resistive trend line from previous tops on the weekly chart around the 2325 area. Question is if this will hold or if it price will continue on through. With 5 straight days of gains now, I wouldn’t be surprised to see some kind of retracement on the daily chart. However, at the moment I don’t see any signs of one. Perhaps the Trump Tax Plan which seems to be driving the market at the moment will be the catalyst that ultimately decides. But right now this bullish move up is showing momentum.
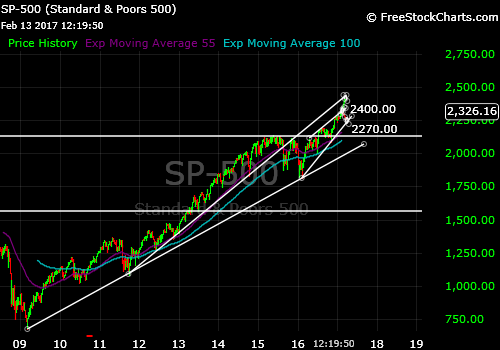
Going back years to 2009 on these trend lines, I see this area as smaller resistance in the long term picture. If price moves through the 2325 area, I think we are looking at price moving toward the underside of the previously broken trend line from Oct 2011 through Aug 2015.
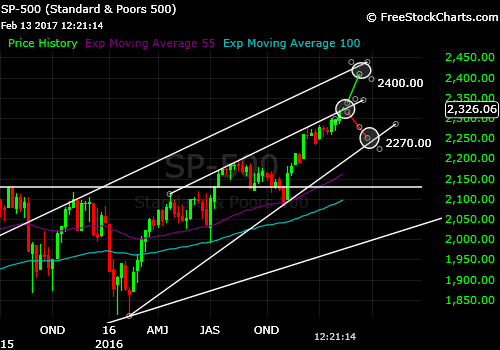
This previous trend line right now points to a target of 2400-2420.00. After all of 2015 and the first half of 2016 being stuck in sideways trading. This move is welcome change to investors, but doesn’t come without risks. Make sure you have a trading strategy for managing your entries and exits on trades. Trade what you see, being nimble in these markets is key.


Comments
No comment yet.