
Gold Trade – End of year targets
Gold Trade End of year targets and where are we headed for 2015.
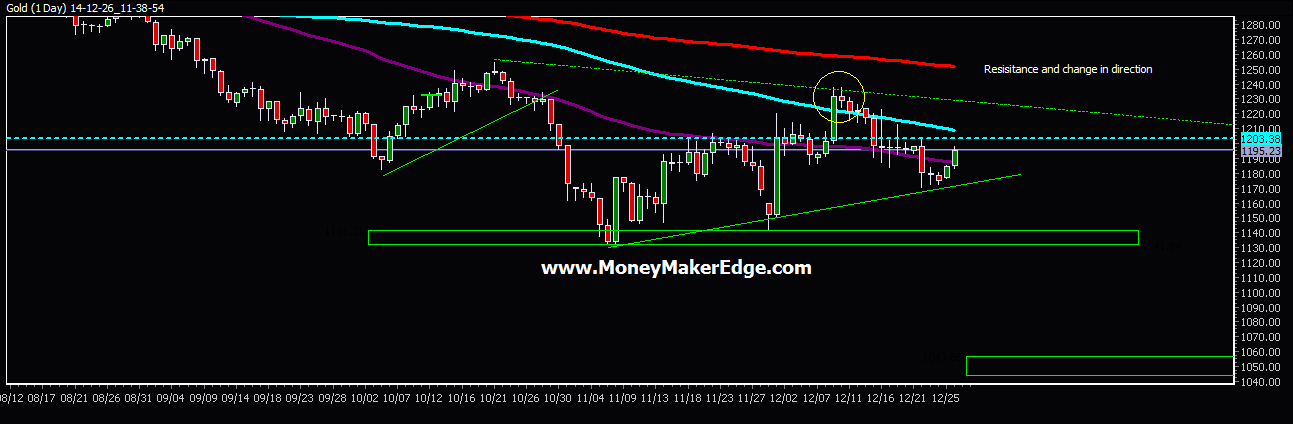 Gold daily chart. There are two ways to look at this chart. The traders expecting gold to bottom and start it’s bull run and the Dollar index traders looking for new highs and corresponding Gold collapse.
2014 saw a yearly high of 1391.71 and low of 1131.85 giving the gold market a yearly $360 range.
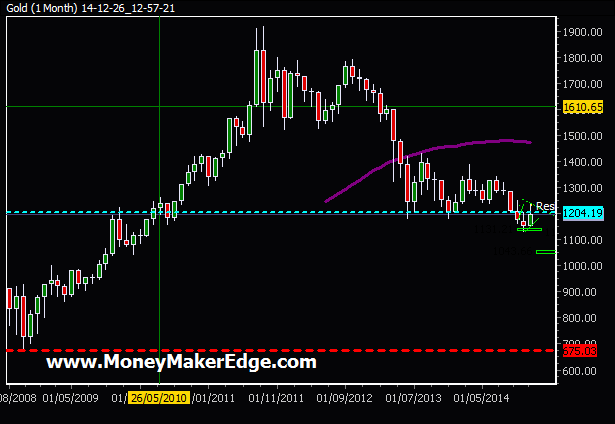
With the Yearly range in mind, let’s take a look at a monthly chart and see what the price action for Gold has been.
 Monthly Gold chart Support and Resistance and possible direction.
Gold has broken under the major support at $1200 and has spent the last two months testing new lows on this bearish cycle.
You can see in the previous chart the 200 day Moving average for gold is coming in the $1254 area and this is the resistance which traders are looking for the turn around and break of this major down trend.
The short term support under 1200 comes in at 1050 and then a full extension would take gold to $840 with a capitulatory target in a major sell off to the previous swing lows at $675.
Remember there are no “rational levels” when trading the volatility of gold and high risk markets. The Dollar index, political pressure and banking manipulation will have a lot of effect as this 2015 keeps course. We have pressure in a declining world economy out of Europe, Russian and even China that could start a continuation of this “super cycle” in commodities.


Comments
No comment yet.