
Day Trading SP500 Stock Market

Stock Market
Day Trading SP500 Stock Market
Was looking on SP500 those last days. Quite few interesting thing happen. First, Sellers start to be more present, and market volatility start to rise. Even $VIXX start to rise, and looking to make new highs.
But if you look deeply, this is kind confusing. On daily chart, SP500 was able to stay above the last bottom at 1957.00 area.
…and depending on different time frame, different direction was showing….so what is going on?
day trading stock
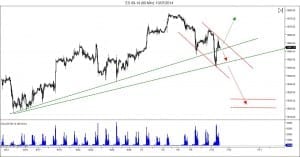
Day Trading SP500 Stock Market 60min Chart
I choose 60min chart, because I was able to clearly see sellers and buyers move with they volatility. If you look closely, you could see that last move down by sellers was extremely low, and buyers was very strong.
By adding few points like: as Buyers create new support trend line, and get back in the market with very strong volume. They show great momentum for the next move up to break sellers bearish Chanel.
Actually..only half of last volume should be more than enough to bring SP500 price back to last tops at 1977.00 area. On sellers side, yes they still have momentum to keep selling, but with all new buyers supports, they would need alot of commitment to bring SP500 Stock Market, back to last bottom.


Comments
No comment yet.