
Day Trading SP500
Day Trading SP500 : Last week we finally start to see sellers get in the game everywhere. Next week we will test few important resistance on different index. For now, I will just focus on SP500 US Index.

S&P500
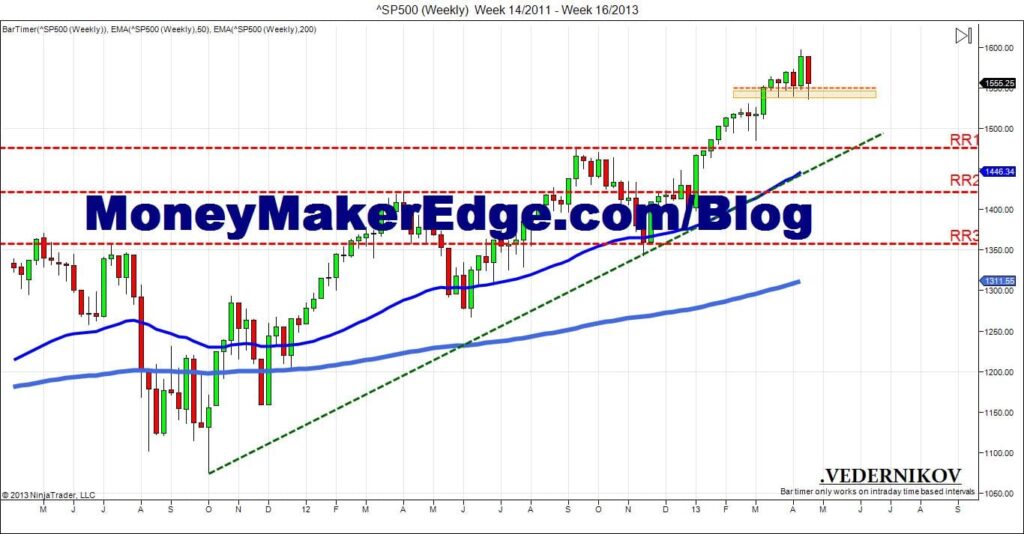
Day trading SP500 Weekly chart Using ^SP-500 Chart
Since December 2012, Is a first time we see sellers candlestick with strong volatility. ~1550 price, are important for next week. For 5 weeks already, sellers try to close under this price, but every time fail to break this support. And every time they show more and more commitment to close under this price.
On buyers side there no commitment anymore. Normally when sellers fail many time to close under certain price, buyers will use this opportunity to bring price at new highs with strong commitment. But this time we don’t see this anymore….Probably at this point, Investors have no more money to invest anymore :)..they realizing price are to High? 🙂

s&p500 chart
On daily Chart, is more easy to see Sellers commitment on this move short, compare to others one during last last 5 weeks. Sellers finally achieve they goal on Thursday and close under 1550 with strong commitment. they also test MA50 and try to close under MA50. Is Normal they din’t succeed and we saw Buyers stop Sellers at this point.
Right now, we are in a fight zone (orange zone), and so far Sellers are winning. Next week, we will see Sellers break this resistance, and go to RR1&200MA on daily. On Sellers road, they have few resistance, since we make new highs. But they should not show any strong importance When Sellers decide to sell, is never easy for buyers to stop them, especially on small resistance.

ES chart
How strong are Sellers? On 60min chart ES E-mini futures we can see
On first movement Short, Sellers just break 200MA , No resistance at all from Buyers side. Volume are only controlled by Sellers. Sellers let buyers go back to about 50%, test 200MA, and one more time, bring SP500 price almost at same level than last movement short. After what we can see in volume sellers taking a break. And with low volume on sellers side, buyers can’t do much. Right now, Sp500 price, will test my Red trend Line, and probably 200MA at the same time. For what I can see, we are in a fight rage on 60min ( Orange Area). It will be very important to see if and how Buyers and Sellers will react on the opening of market. Like always, Is important to see who’s in control, and how Sellers or Buyers Control they price.

volatility Index
Volatility Index on Daily
I make a post about VIX not long time ago, and mention to see if VIX price will be able to close above 200MA. First time they fail, but last week they finally succeed. The importance of this move it can be critical for Market.
So far, it look like my red Short trend line, can be used as support for Vix buyers on this chart, and 200MA also. Now what is important to see, is if Vix will break Lower High Trend.
Short Target for SP500: 1532 – RR1 – RR2 – RR3 Long Target for SP500: 1560 -1568
What to watch for? 60 minutes chart, how Market will react on the 200MA, I will say taking a Long trade is up to you, but for my self I will concentrate my effort only on Short trade, and will prefer to miss long trade.


Comments
No comment yet.