
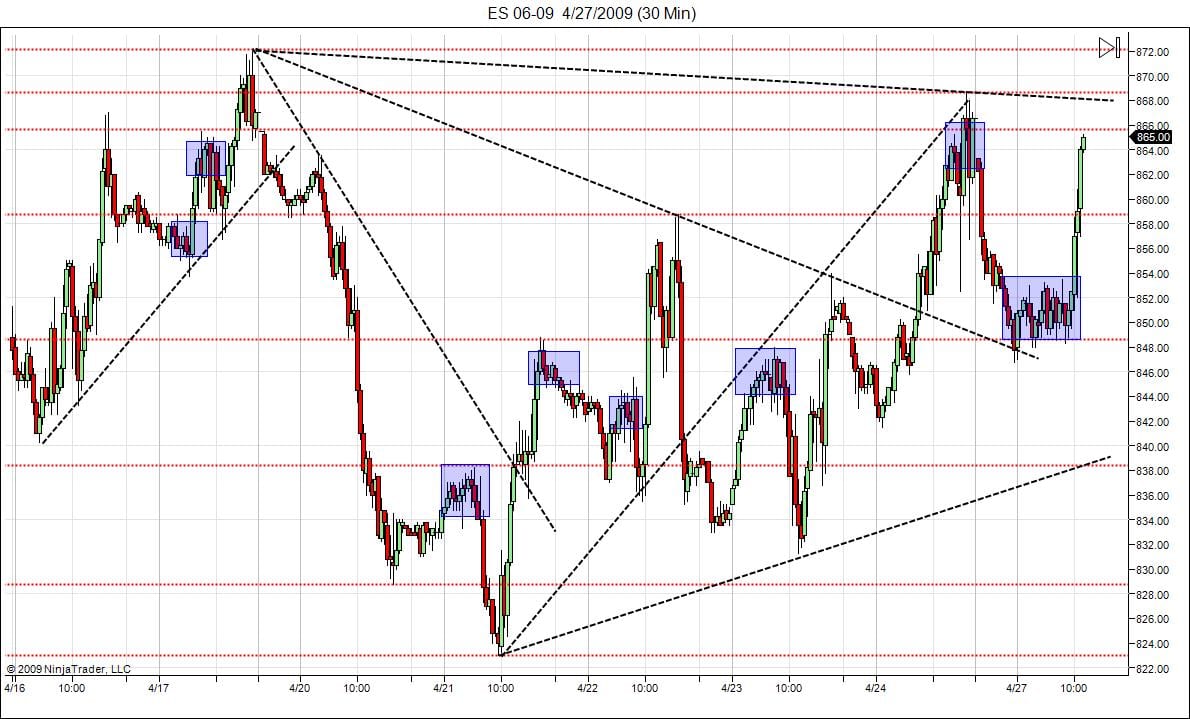
S&P 500 emini futures Support and resistance 30 min
S&P 500 emini futures day trading, the support and resistance levels for the last week. Looking at congestions zones and areas for a break out. You can see major trend lines and decreasing swings on the chart.
Click on the chart to ENLARGE it.
New to Money Maker Edge? Start here.
Everything on this blog comes from one method: defined risk, a written plan, and live trading with a group. Learn it in three days, then trade it every market day.
The 3-day day trading course · The live trading room · Day trading psychology · Call 866-640-3737


Great chart