
Day Trading Natural Gas
Day Trading Natural Gas, update from last post.
Day Trading Natural Gas
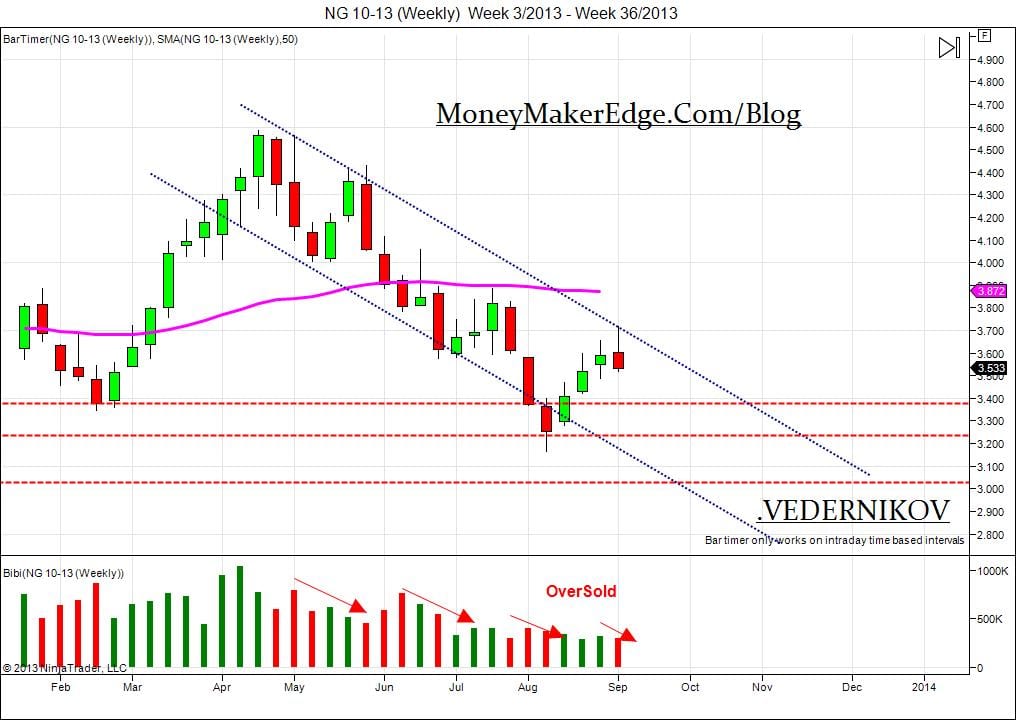
On Weekly Chart of NG:
Weekly chart give us a nice short signal. And as I mention before, it should be last one, before NG start to go Bullish.
On every move short, sellers become less stronger every time and price is way to low. Even if it can go as low as 2$, I see no commitment from sellers side to go back there.
On next movement, we will get or confirmation from NG.
1st&2nd red line: at this price area sellers should stop,and buyers show up!
3nd Red Line: this is critical area, if sellers pass this red line,we may see Natural Gas go back to 2$.

Day Trading Natural Gas
On Daily chart and 480min:
If you look on daily Chart, you will see buyers hitting 100k volume Again. Last time when they was hitting that high, it was about 4-5 months ago. On sellers Side, the struggle.
480min Chart:
On this chart, we can see how Sellers took advantage of 200MA. And break buyers support trend line.
120min Chart:
If you go back on 2h chart history, you will see 2nd move short was way to low vs previous one, (on Sellers side).
So far I’m still short on NG, but just waiting my Long entry.


Comments
No comment yet.