
Day Trading Gold
Day Trading Gold, using GC chart on Ninja Trader 7

gold chart
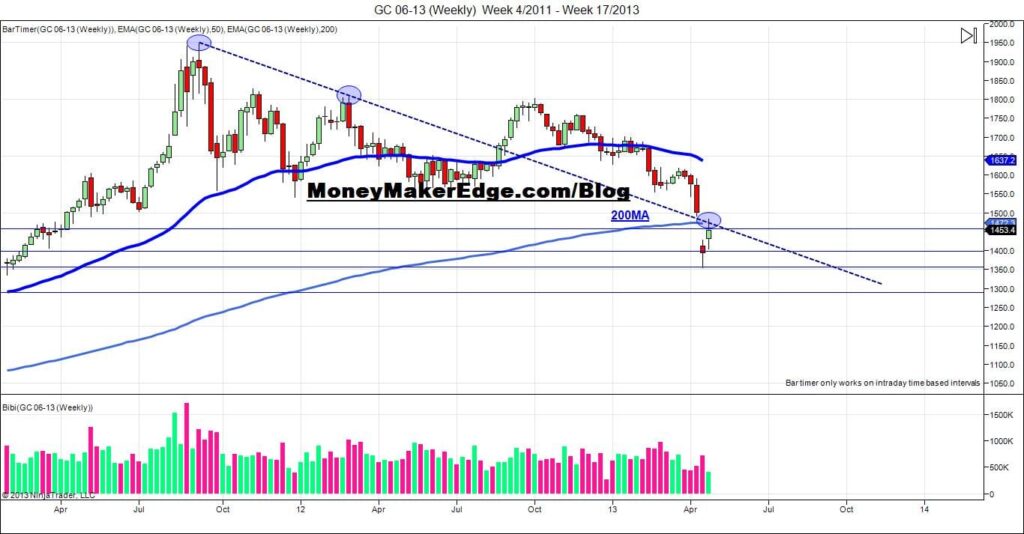
Day Trading Gold Weekly Chart
Will gold go lower? Well, on weekly chart we can see that gold got a very nice Ret. so far. Gold price fill the Gap, but was not able to pass 200MA on weekly chart.
Look at buyers volume on last week. Not much, very low in buyers commitment. Buyers was also not able to pass Bearish trend line last week.

day trading gold
Day Trading Gold ; 1440 min chart
On this chart we can see that gold hit 50% Ret. Fibonacci. my Targets are my blue line for Short position and 200MA for Long position.
Volume: If you take a look on volume, you will see that buyers was not able to hit more than 50% of last sellers move. And every day they was losing strength.
We also,did not pass 50% Ret. Fibonacci and close with indecision winning slightly by Sellers.

day trading gold
Day Trading Gold 60 min chart
As you can see,on 60 min chart we was and are on bullish trend all week. But at the end, Sellers did not let buyers hit the up trend of bullish trend, by creating a nice double top ( Red line). We also have a nice view of Sellers get in the market, very strong volume for 60min chart.
So far we did not break the bullish trend, and buyers are supported by 200MA and 50MA. Watch carefully if sellers will break this trend on Monday. If they do, we should see sellers retest 1400 price at first and then the double bottom from last move down.
Market start to be more exited don’t miss you chance, start to make money online every day. Learn How to trade and get in the Game! Great Trading for everyone, next week will be very interesting to see if S&P500 will make a turn over.


Comments
No comment yet.