
Day Trading Dow Jones Industrial Average
Day Trading Dow Jones Industrial Average

DJIA 1928-29
DJIA 1928-1929 chart and 2013-2014 chart
Market are definitely in a very stressful pattern.with this chart that most of people saw, there’s some question people are asking them self, should you sell or keep buying since we are in Up trend.
What people may don’t see, is what happening in others area, like Gold,Silver, Oil …start to make a strong move up. And with all suicides that happen, and probably will keep happening from banking system, maybe you should start to ask your self some questions. And I’m not talking about 2weeks of very bad news on the market, but Stocks Market keep moving up. Very strange isn’t?

DJIA 2014
Dow Jones Industrial Average 2014 Chart, very clear H&S pattern
This is pretty much how a weekly chart end last week. (even if this chart are on daily, if you go on weekly you will see same thing). Also on weekly market finish with a “Doji“, what means an un-decision from buyers and sellers. And it can give us a direction from both side.
Yes DJIA is still in a Bull market, and won’t be easy to break this. And if it does, it will drop very quickly. My interest is not scary anyone or tell what to do, but give you a few reasons of why you should ask your self question about what to do, and find a way to protect your valuable assets from potential crisis. (Personal opinion, from what happen since 2 weeks, Financial crisis just started)

DJIA Daily Chart
H &S Pattern on DJIA Daily chart
H&S is a very strong pattern, can go both way, or stay for a will in a range before make a break out for mid-term or better, long-term direction. This is actually an update of my chart above, with some drawing that shows you the pattern for next week we should see on Stock Market. Yes it also can go long, but the stronger pattern are actually for short direction.
To go back on my chart, I’m looking to see sellers bring DJIA price to the first shoulders bottom.

DJIA inv h&s
DJIA Inverted pattern of Head And Shoulders
Once we see Sellers retesting 15 700 area, an Inverted Head and Shoulders will be created on DJIA. This is start to be very interesting, H&S following by Invt. H&S. No matter of the breakout will be Long or Short, it will be very strong one, It will give us a direction for next few months.
Also, notice, that the range DJIA are in. Between 50MA and 200MA, what give even more pressure from both side.
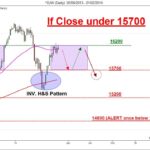
if close under 15700
if close under 15700 …what will happen, what are next targets?
Very important, it need to “CLOSE” under, if it doesn’t, it will more likely be a head fake.
For short, I did not draw, but watch how it will resist or not on 200MA. Since this target are very close, if we see a breakout from move down with low volume, my action will be to sell on 200MA, if sellers move DJIA price down with very strong volume, 200MA won’t be important.
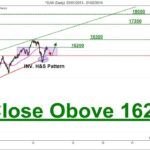
if close above 16200
If close Above 16200…it will be a home run to 18000 points
Because H&S can breakout from both side, we need to be ready from both move. Last chart was about what may happen by seeing sellers taking the direction. And on this chart, what we may see if Buyers taking the direction. With 1st target as double top, that I don’t think it will act as a resistance since this breakout should just go true with not much resistance, my first target will be at 1700. following by 17300 and 18000. Once hit 1800, it will be an Over Bough price,and we should see again a Question “?” mark on the market for following direction.
The question you may ask me, why then, I say we are in a financial crisis? well, like I said, you need to dig deeper than you are seeing on your TV and what your Financial Adviser say to you. This is a very long subject and won’t discus about or make a blog about. All I think you should ask your question, does it can go Up forever? and if you say to your self , “No”, when do you sell, and why?
Comments
No comment yet.