

Trading Crude Oil
Trading Crude Oil , using E-mini Futures QM Chart

crude oil trading
Trading Crude Oil Pennant
On Weekly QM chart we can see buyers fail to close or stay above 200MA. And from sellers side, they fail to pass bullish trend line. For next movement, I’m both Short And Long.But more likely to go for a short one.
Crude Oil trading chart
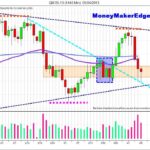
Trading Crude Oil 1440min Chart
This is a big picture of what is going on. Sellers showing lots of commitment, but have hard time to pass my orange area (fight zone).
Cyan Line: This trend line was a support for sellers, and my Reversal point to take a short trade. But for this time, I don’t see this trend line act as reversal, but more likely to act as a trend than will give a break to sellers before they try again to creak a bearish pennant.
Orange/Pink DOT: Is to show that we have a good chance to fall in a Higher low Trend or Lower High Trend very soon.

day trading crude oil
Trading Crude Oil on 60minutes Chart
On last movement down, sellers show lots of commitment on first 2 moves. But fail on the last one. And again, fail to close under 92.3price ( Green line). Last move was very important on short term to keep bearish trend . But because they fail, they also break this trend, and now we see buyers get in the market and will bring market price back to 94.4$ (200MA or 50MA on chart). Once we get to this price, are Direction&Targets will be determine by each party commitment and who control 94.4 price. Once we go back to 94.4 I will update my post on Direction & Targets.


Comments
No comment yet.