S&P500 day trading course levels of support and resistance.As you can see we retraced back to the yellow resistance line at 1160 that I have drawn in from the initial break down on 6th of May with our 200 MA as the target.I am expecting this to consolidate in this ... Read More

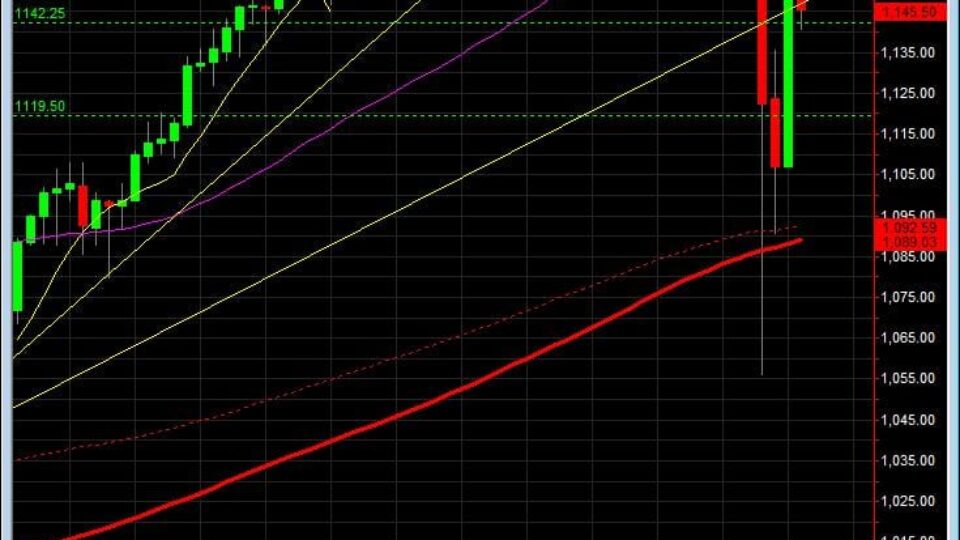
11
May2010
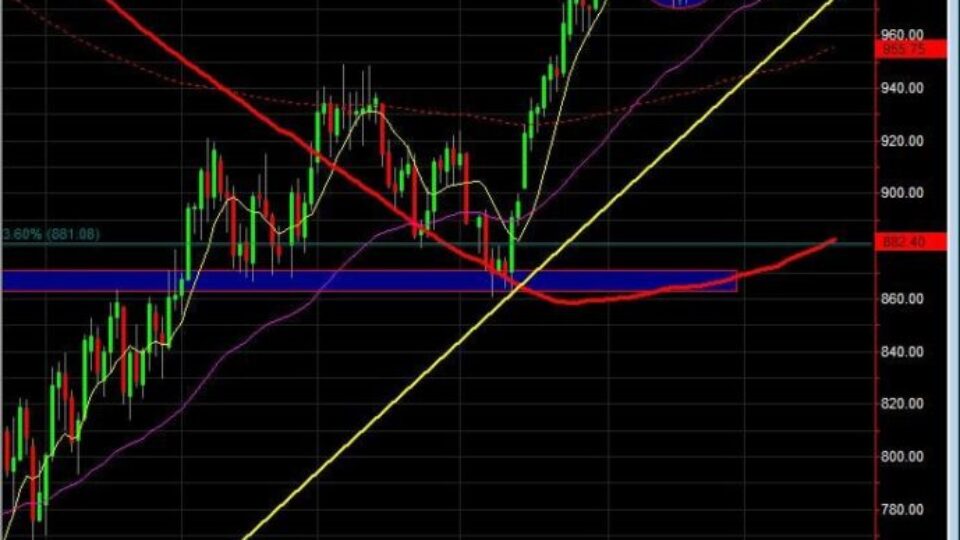
21
Sep2009
S&P 500 day trading daily chart for Sept 21.
Testing resistance. Probably be in top side consolidation with a test down to give us a chance for more buyers to step in. Could be stepping into a narrow range for trading this week until new direction is determined.

24
Nov2008
S&P 500 emini futures Daily chart nov 24Too big to fail. Too big to fail, it must be nice to be too big to fail.
What ... Read More