S&P500 Support and zone Resistance - Old support Technical trading
S&P500 ETF $SPY trading chart. We are going to look at the S&P500 areas of support and resistance.Watch price action on $SPY we put in a high volume low with sellers capitulating in the Bear Market Price Zone. We ... Read More


09
Jan2019

27
Jul2015
End of the month trading plan for July 2015 into 1st trading week of August.
The Weekly chart on the S&P500 emini futures shows an Engulfing bearish candlestick on the last week. This is where the ... Read More
22
Jul2015
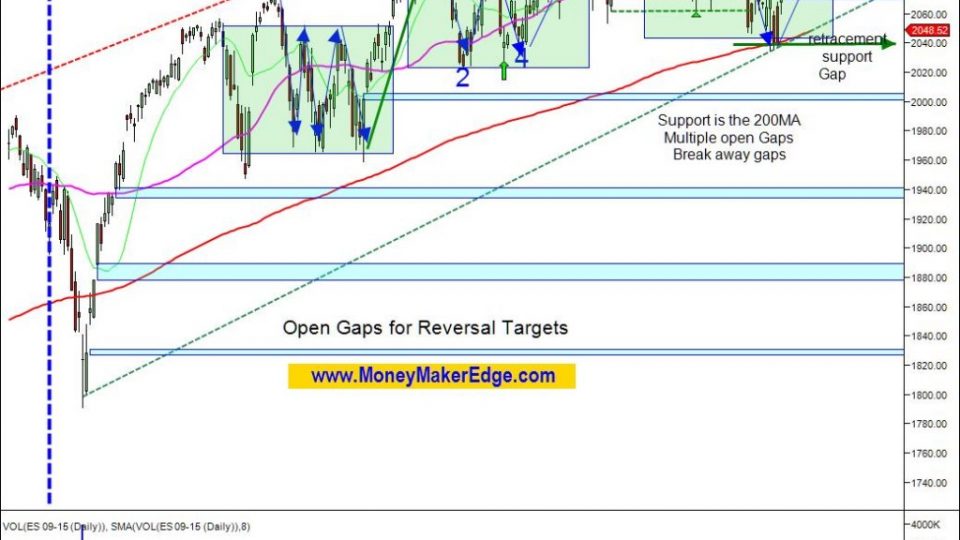
Trading plan in to August 2015 - Mind the gap
The US markets had a partial correction with a few break away gaps which can become longer term targets for the next move down by sellers. The first ... Read More
- Previous
- 1
- 2