Gold H&S Pattern
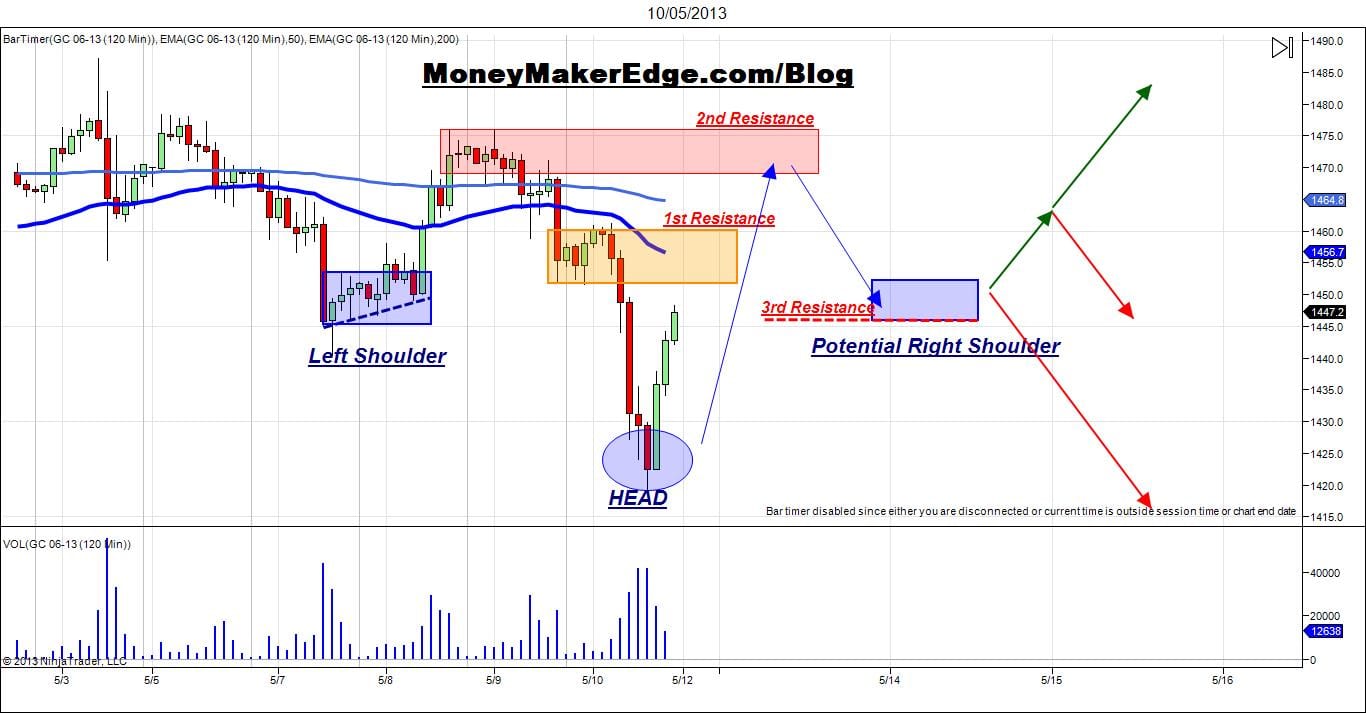
Gold H&S Pattern on 120min chart , GC 06-13 Futures Contract
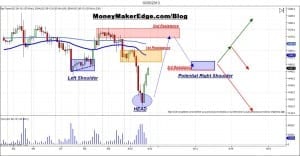
GOLD H&S Pattern ( what we may See)
On 240 and 120 minutes, we can see a nice Potential of H&S Pattern. If this Pattern Succeed we should finally see if Gold will go Long(above 1500points) to or Short(retest 1340points). Few trader are thinking gold will keep losing value again very soon. For my self, I’m not sure any more, why? 1st I don’t like when we reach 50% Ret. of Fibonacci and start to consolidate. And 2nd, on Friday, Sellers finally break the consolidation, but fail to keep gold price under 1440 points.
Is why I’m will just watch how gold will react at Right Shoulder.
Take a note, to see this H&S pattern, few thing need to be done:
1st Ressistance: Buyers need to pass this Consolidation Area to be able retest my 2nd Resistance.
2nd Ressistance: this Area are very important, if Sellers show Up at 200MA, they may fail by get in the market too fast. But If they let buyers pass 200MA, and retest the double top, the 200MA will be a Resistance for sellers, since buyers will be above. And it will be harder for sellers to close under.
3rd Resistance: at this level sellers should stop,let buyers get back in the game, and then will see if Gold direction will be Long or Short.