
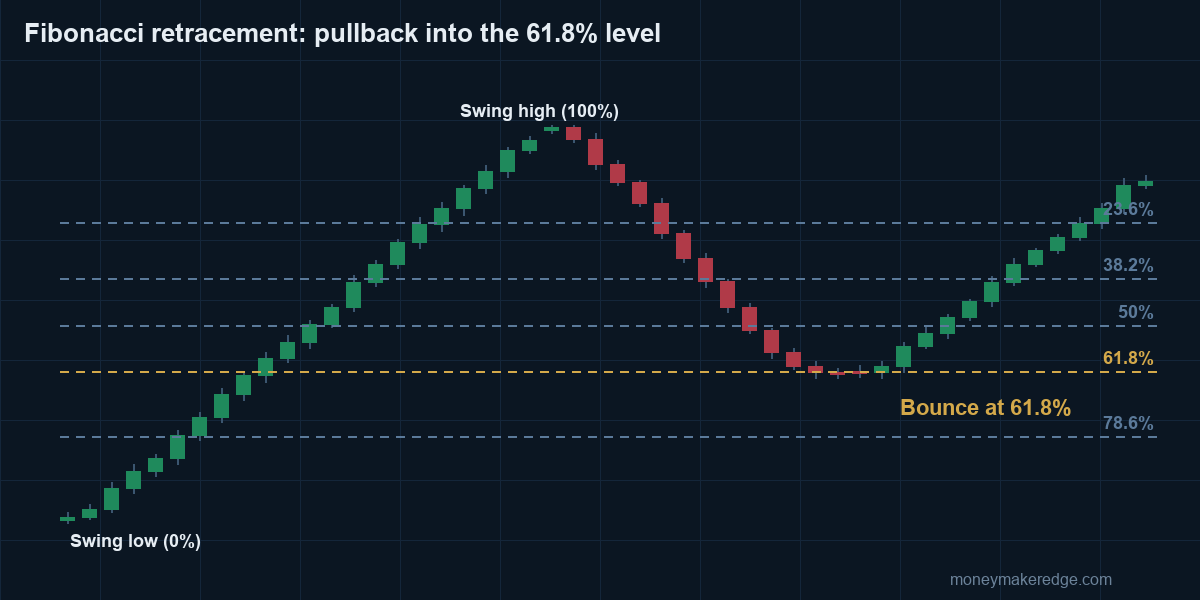
Fibonacci retracements are one of the few tools that almost every futures and stock trader has on the screen – which is exactly why they work as often as they do. Enough traders expect a pullback to pause at 38.2%, 50% or 61.8% of the previous swing that the levels become self-fulfilling areas of support and resistance. The skill is not in drawing them; it is in knowing which swing to measure and what to do when price gets there.
How to draw a Fibonacci retracement
- Find the most recent clean swing: a low to a high in an uptrend, a high to a low in a downtrend. On the S&P 500 emini we use the swing that the current session is reacting to, not one from three weeks ago.
- Anchor the tool at the swing low and drag to the swing high (reverse for a downtrend). The levels that matter are 38.2%, 50% and 61.8%; 23.6% is usually too shallow and 78.6% means the move is probably failing.
- Look for confluence: a retracement level that lines up with a prior support level, a moving average, or a gap edge is worth far more than a Fibonacci line on its own.
The 61.8% level is the decision point
In a healthy trend, pullbacks tend to hold between 38.2% and 61.8%. The 61.8% level is where the market makers decide: either buyers step in and the trend resumes, or the level breaks and the swing is over. We treat 61.8% as the last place to look for a with-trend entry, and a close beyond it as the signal to stand aside and wait for a new structure.
Trading the retracement with defined risk
A retracement is only a trade idea until the risk is defined. The entry comes on the first sign of rejection at the level (a bullish engulfing candle, a higher low on the lower timeframe); the stop goes a few ticks beyond the 78.6% level, where the pattern is clearly wrong; the first target is the prior swing high. That gives a 2:1 reward-to-risk on a normal pullback, which is why we can be profitable with a win rate below 50%.
Common mistakes
- Measuring the wrong swing. If you have to hunt for a swing that makes the levels fit, the levels are not there.
- Buying the level blind. Wait for price to react; the level is a place to look for a trade, not a reason to take one.
- Ignoring the trend. Retracement entries are with-trend entries. Counter-trend Fibonacci levels get run through.
Related: price channels, the Elliott Wave principle and our guide to support and resistance.
Want to trade this with defined risk and a written plan? That is exactly what the 3-day day trading course teaches, and what we do every market day in the live trading room. Call 866-640-3737.