Day Trading Course – Ranging

- Day trading course l 866-640-3737 l learn how to daytrade l Day trading education
Trading the S&P500 emini futures contract in the S&P500 day trading course live room.
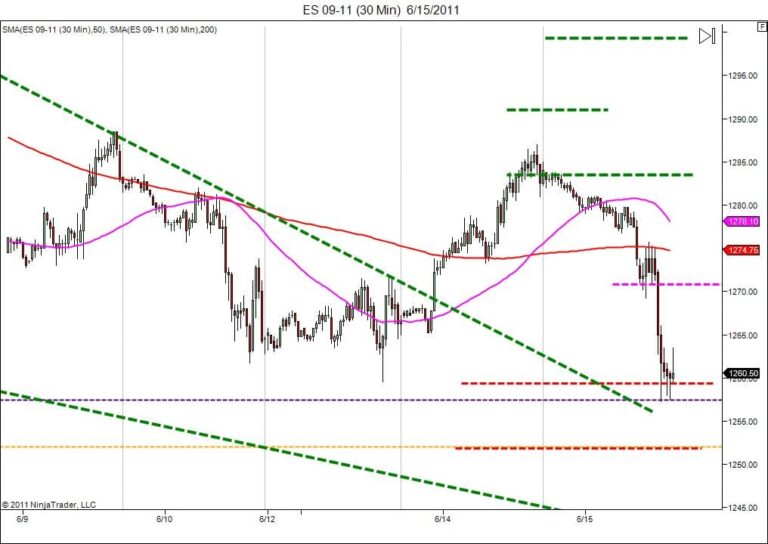
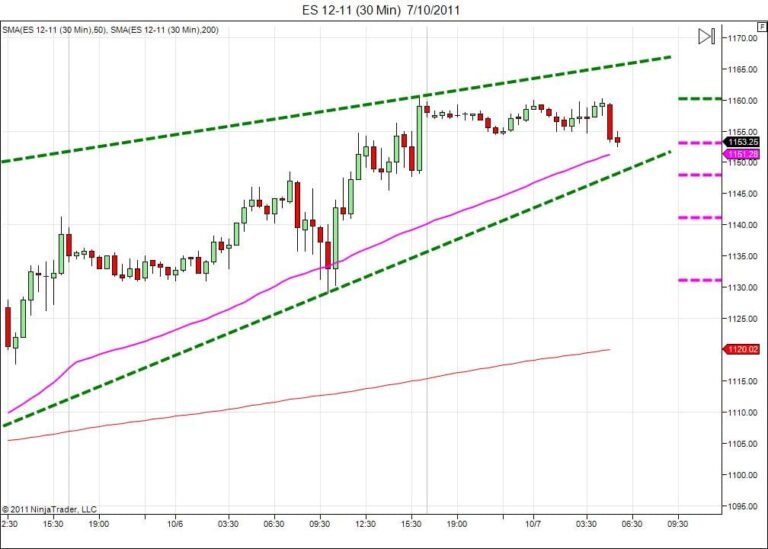
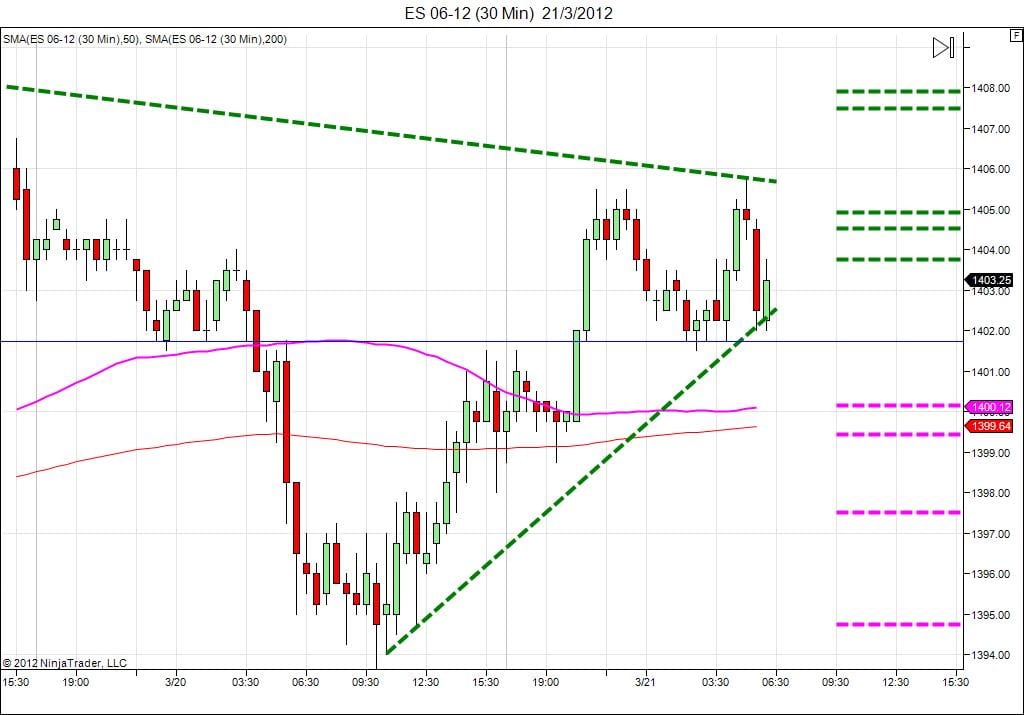
There is a general range between support at 1393.50 and resistance at 1408. When price pierced and broke through the support level at 1393.50 there was a price failure and a move to the upside. After consolidation and testing resistance at 1401.75 price broke through to reach up and start a new range with 1401.75 now acting as support, as in the past after hours trading of Monday 3/19. Resistance is now at the top of the range at 1405.50 level. Sellers have now come in with some commitment to try and test support again. If they break through, the first target is the strong support level of 1401.75. Next target is 1400.25 on down to the next targets at 1399.50, 1397.50,1394.75 and outer target of 1391.75. If buyers come back in buyers pressure will bring price up to again test the upper range at 1403.75. Next targets will be 1404.50,1405.50 and outer target at the 1407.50 – 1408 range.
Trade What You See
New to Money Maker Edge? Start here.
Everything on this blog comes from one method: defined risk, a written plan, and live trading with a group. Learn it in three days, then trade it every market day.
The 3-day day trading course · The live trading room · Day trading psychology · Call 866-640-3737