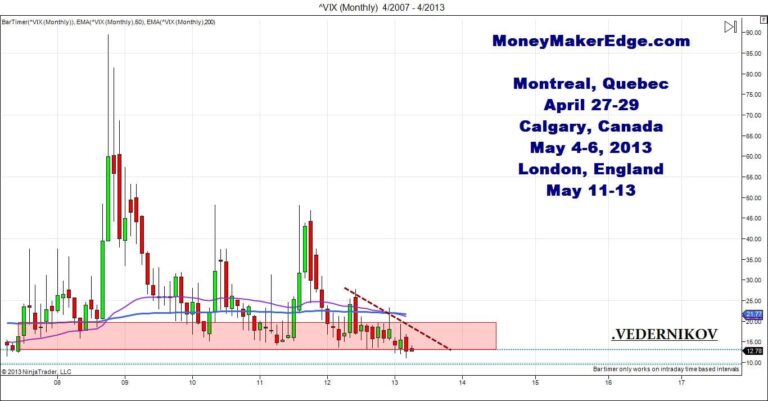
Day trading Market ,using Vix to show market volatilityDay trading Market , VIX monthly chart
I put this monthly chart if Vix, to show you a big picture. The Red are, is everything below 20 points.For me is area where market i... Read More
Category: learn how to trade
23
Feb2013
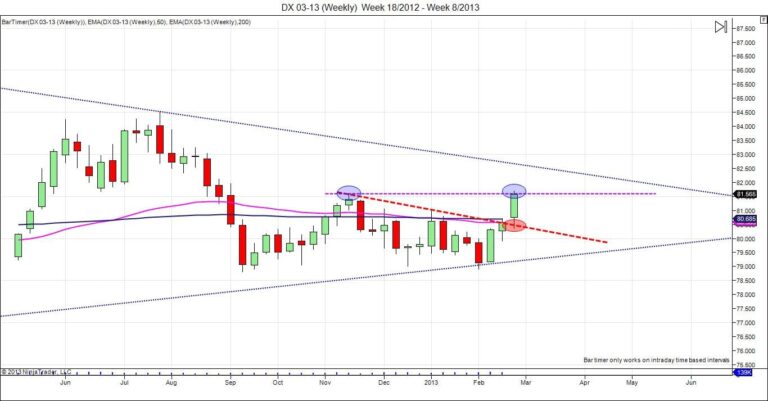
US$ Direction on DX 03-13 E-mini Futures Contract
My direction Long term, in "Long" if we keep the same commitment from buyers. Right now, we should take a break as a consolidation or go back to resistance #2 or #3.US$ Direction Weekly:On ... Read More
February 23, 2013Konstantin Vedernikov
12
Jan2013
Hi Traders,we are moving to the double top of 2000 & 2008. Is why on this post, I will use S&P 500 Index, to show you what's going on and talk about Market Movement.-----------------------------------------------------------------------------------First Part: Will be about Market Movement with S&P500Second Part: Is ... Read More
January 12, 2013Konstantin Vedernikov