Day Trading S&P 500 Chart
Hi Traders,we are moving to the double top of 2000 & 2008. Is why on this post, I will use S&P 500 Index, to show you what’s going on and talk about Market Movement.
———————————————————————————–
First Part: Will be about Market Movement with S&P500
Second Part: Is about Targets on ES 1440 charts for next week.
————————————————————————————–
First Part
Day Trading Monthly Movement of Market

Dark Green Trends Lines: This is to show you how confident Buyers was few month ago.
Lime Green Trends Lines : As you can see…after 1300 points, Sellers and Buyers are more careful. and we have more consolidation zone, and almost every time, we have important unsupported price.
RED Trend Line: Buyers may pass this trend line, but if they don’t close above, expect sellers get in and with a lot’s of commitment.
Dark Line: 1st one, is a double top, that buyers need to pass, to make a Higher High level. If they achieve this, Next long term target will be ~1530.
Day Trading Weekly Movement of Market

On this chart, we can see Buyers getting in the market before we go to 50MA and touch are trend line. I don’t know if they was to exited about “fixing” Fiscal Cliff for 2 months or they party to much on New Year. However…Buyers are better close above my “Red Line” if not, on weekly chart, we may go back to MA50 and MA 200.
Day Trading Daily Movement of Market

On Daily chart, we can see that before buyers let sellers get in, and respect 50% Fibonacci retracement. This time, buyers get in the market way to fast. With not much volume (you will see on my next ES 1440 charts). They didn’t close above the double top, not even touch it, miss it by 2points.
We close on “Doji” candlestick. Buyers better get in market and show some STRONG commitment if not…they will regret this last “RUSH“.
Conclusion for Market Movement on S&P 500 US Index:
What I can see, if we put all those 3 charts movement together.Buyers, are less confident now than few months ago. And start to lose discipline.Sellers are more likely waiting the perfect moment to get in and pay back for buyers lack of discipline.
Second Part:
Day trading Chart of Targets for next week on ES E-mini Futures.
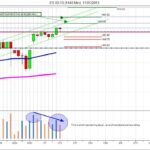
After week of consolidation, I don’t see any long term consolidation for next week, but won’t be surprise if we do get one. Is why if you take any trade next week, I will suggest to keep your targets close to your entry points … be always ready to get out if it doesn’t go your way any more.
This Week I’m Neutral ( because we have to many double top after this one, I will be more Short than Long.)
PS: VOLUME: As you can see ES 1440(Daily), Buyers keep pushing Up, and “Rushing” with less volume than before.
Thank you and have a great week traders
PS: Day trading is not easy,we are in dangerous zone now, I don’t recommend to get in the market now, if your not well educated about Market&Trading.
New to Money Maker Edge? Start here.
Everything on this blog comes from one method: defined risk, a written plan, and live trading with a group. Learn it in three days, then trade it every market day.
The 3-day day trading course · The live trading room · Day trading psychology · Call 866-640-3737