Aussie Dollar waiting for a pull back
Aussie Dollar waiting for a pull back
Break Out on Weekly Chart
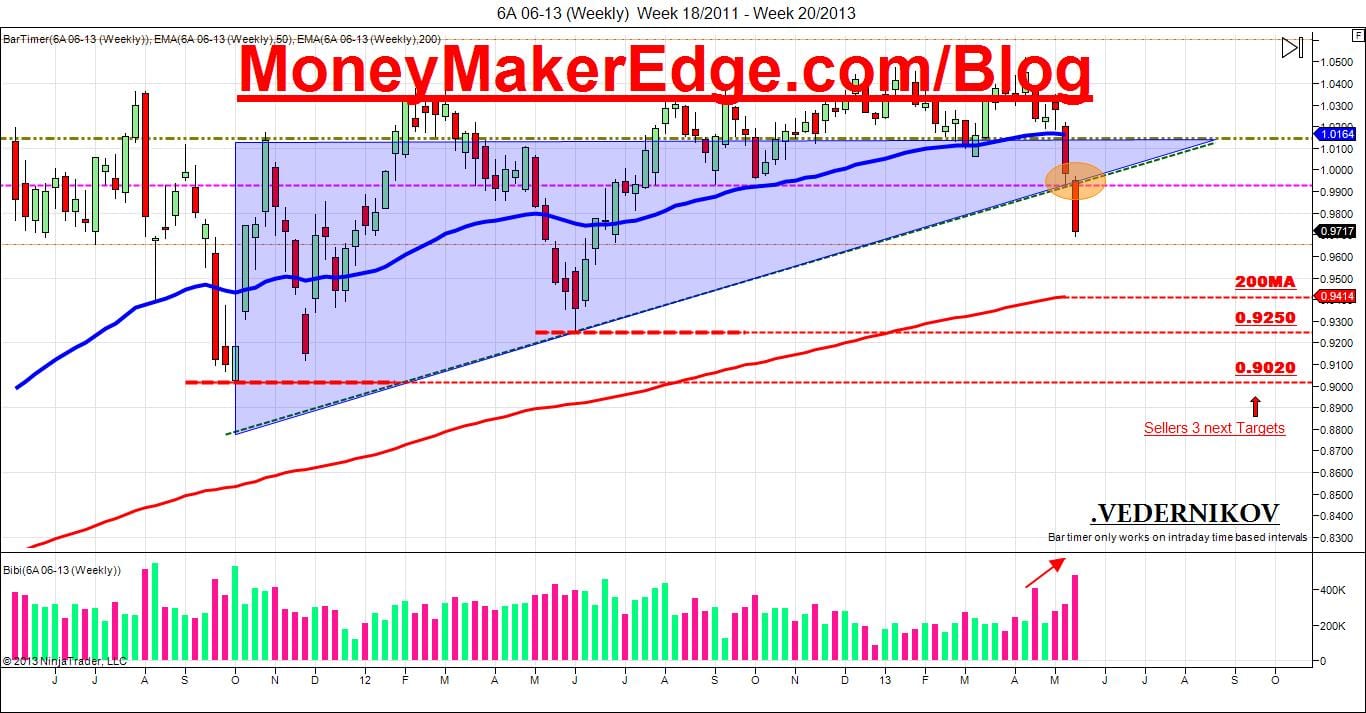
Last week sellers made a Break Out on Weekly chart, after breaking Bullish Trend line.I was looking to see a pull back, but Buyers din’t show they presence at all, and Sellers keep they direction. And after this second week ,look like Sellers are committed to go to the 200MA. Since we pass all major resistances, this should not be hard to achieve.
Volume: On volume part, Sellers Keep they commitment and even make it stronger.For those who miss last trade short, I suggest to wait for a pull back. It may happen may not.Taking short right know, is very risky.
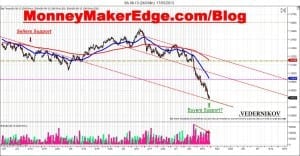
I was working this week to see where&when we should see Aussie price pull back for next Long/Short trades depending on your strategies.
On 240min chart 6A , we are testing past trend line, this trend line was great support for sellers.Right now, it look like it may support Buyers Price. And give them some momentum to bring Aussie price Up.
One of the reason why It look like we may get a support here, is because buyers volume start to increase as we move at this trend line(60min chart). And Aussie are Over Sold,if we compare to 50MA.
For those who are looking to take Short Position, wait till we go back to 50MA

I choose 60min chart for those who are interesting to take next Long/Short Trade. On 60min we can clearly see a bearish Trend with very nice Lower–Higher trend and 50MA who act very well to take Short trades/or for Long Targets.
Right now,Aussie are in a small consolidation , sellers have hard time to break this new Buyers Support trend line. For traders who are interesting to go Long, your first targets will be 50MA. Control your stop properly, because I won’t be surprise to see sellers come back and retest 0.9700 price.
For those who are more likely to take short trade, 50MA can be a nice area where you can take a Short Trade, but as I said before, is less risky to wait till Aussie price go back to 200MA ( 50MA on 240min chart). And your first short target will be 0.9700 ( retest last lowest price), following by 200MA on weekly chart.
New to Money Maker Edge? Start here.
Everything on this blog comes from one method: defined risk, a written plan, and live trading with a group. Learn it in three days, then trade it every market day.
The 3-day day trading course · The live trading room · Day trading psychology · Call 866-640-3737