
Day Trading Oil Crude
Day Trading Oil Crude , by using E-mini QM Charts

Day trading Oil Crude
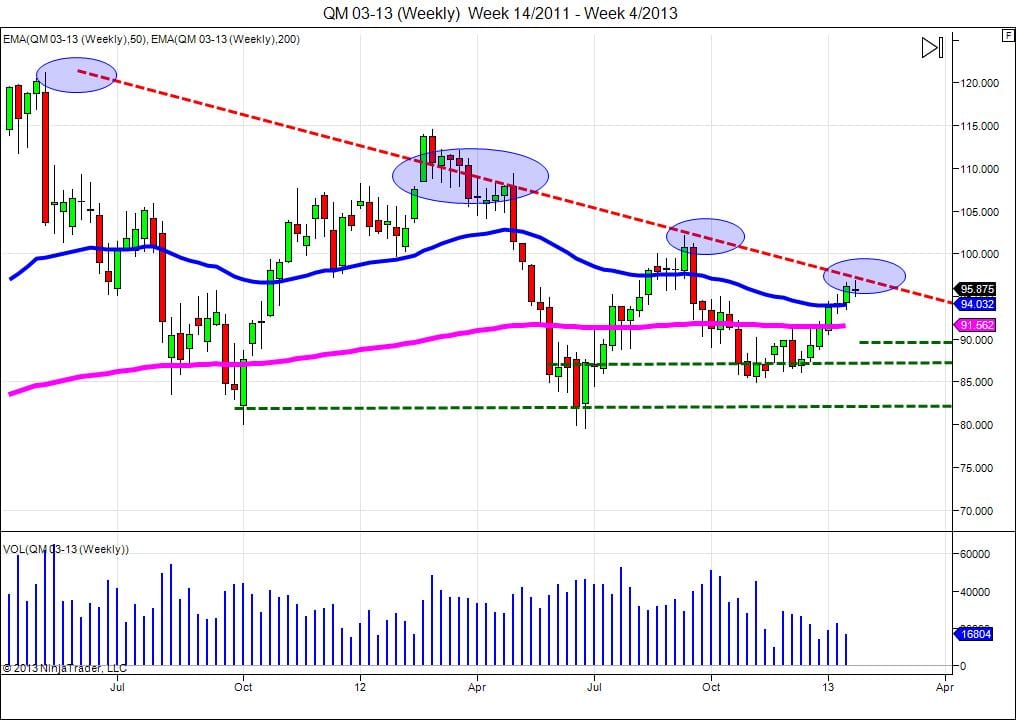
Day trading Oil Crude Weekly Chart / Monthly Chart
AS you can see, we touch once again the “red short trend line”. And we finish with a Doji.
If this months we close lower than 94.00 price, we are going to test my “2 green line”. Also is my long term targets.
My “Small green Line” is my first target to get hit on weekly chart.
For Next weeks, I’m looking for short Oil, if we close under 94.00.

Oil Crude Day trading Chart
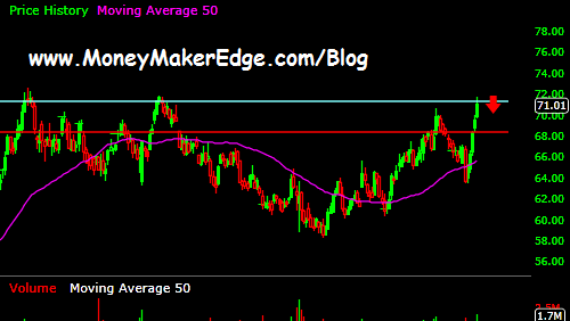
Day Trading Oil Crude Daily Chart with targets
Monday, like for most of my direction will be a decisive day. We are at the end of consolidation.
Direction for Oil Crude:
Long or short: depends if we close above/under a trend line. And we need a clear winner. Sellers or Buyers with more than 6k of volume. And watch out for Head Fake!
PS: even if on day trading Oil Crude chart we have a “Long” trend, The “red line” i use to show or down trend, are much more stronger. Is why if buyers win at start, they may not support the price at the end of the day.
” NEXT POST IS ON GOLD “
Comments
No comment yet.