Day Trading DAX
Hi traders! This week let’s focus on DAX Index.(FDAX 03-13)
Day Trading Monthly Chart
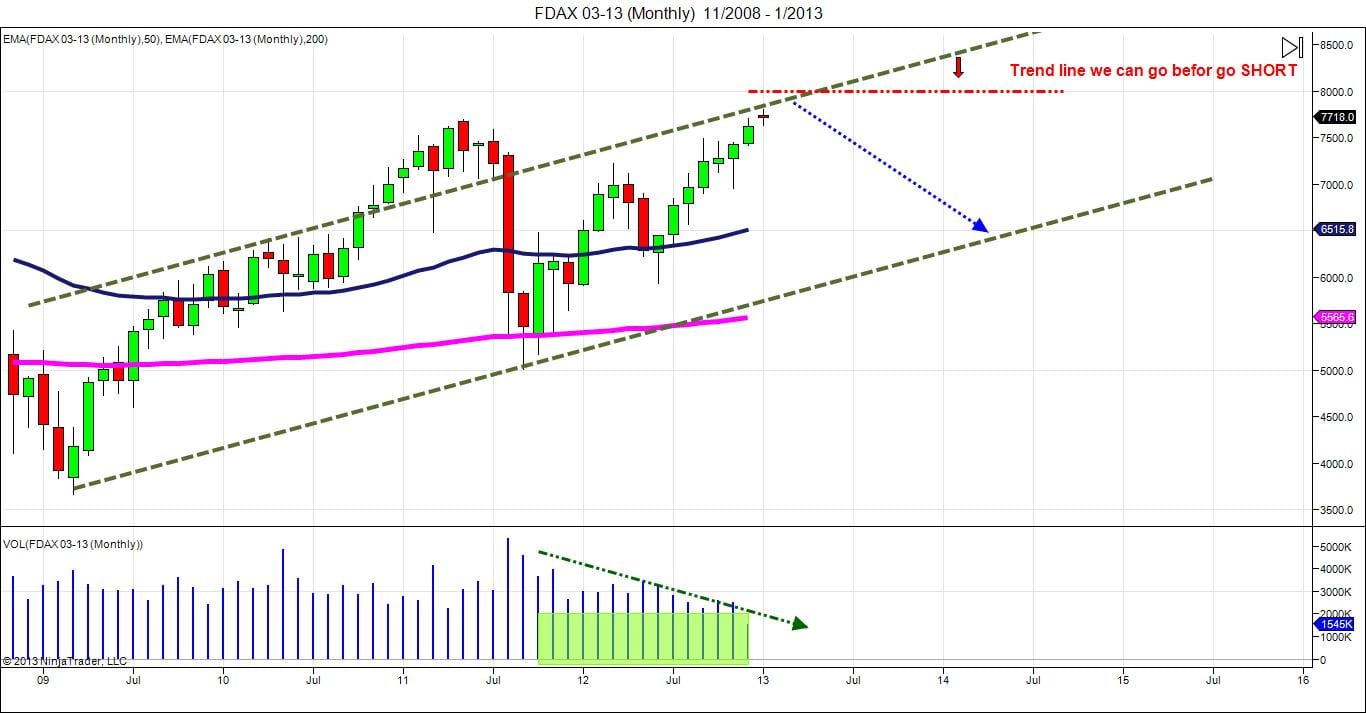
On monthly chart, we can easily see are “Long trend” with a possibility of Short opportunity . Be aware, this month is not finish yet, and the candlestick can be different at the end of this month. Also look on volumes, they drop…no surprise at this level price. That mean we are going in a consolidation zone to see if buyers will keep buying or sellers will take over.
Day Trading Weekly Chart

For now,Sellers are wining. The reason I’m waiting till the end of this month, is because we may see sellers win for a short terms. And then let buyers take the control of market to exhausts them. And then, Sellers will take control again more easily. If we see this, buyers can go till double top or my “Red line”.
“Short blue Line”: As you can see, volatility drop and volume also.
NOTE: Targets for short positions was updated and for Long position are same.
Day Trading Daily Chart
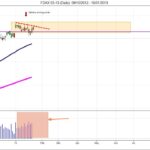
As you can see, Sellers winning this consolidation, so far…But My past “violet line” are supporting buyers price.
!!! Watch daily Volume!!! for Direction
No direction so far for day trading level for me, but is a great time for Scalping!
New to Money Maker Edge? Start here.
Everything on this blog comes from one method: defined risk, a written plan, and live trading with a group. Learn it in three days, then trade it every market day.
The 3-day day trading course · The live trading room · Day trading psychology · Call 866-640-3737