
S&P500 weekly chart, learn to trade emini futures.
Watching for a mid term double top on the S&P 500 emini futures. seems that we came back up to the previous high with less volume. Presently there is a 48.75 range which is lower than the average.
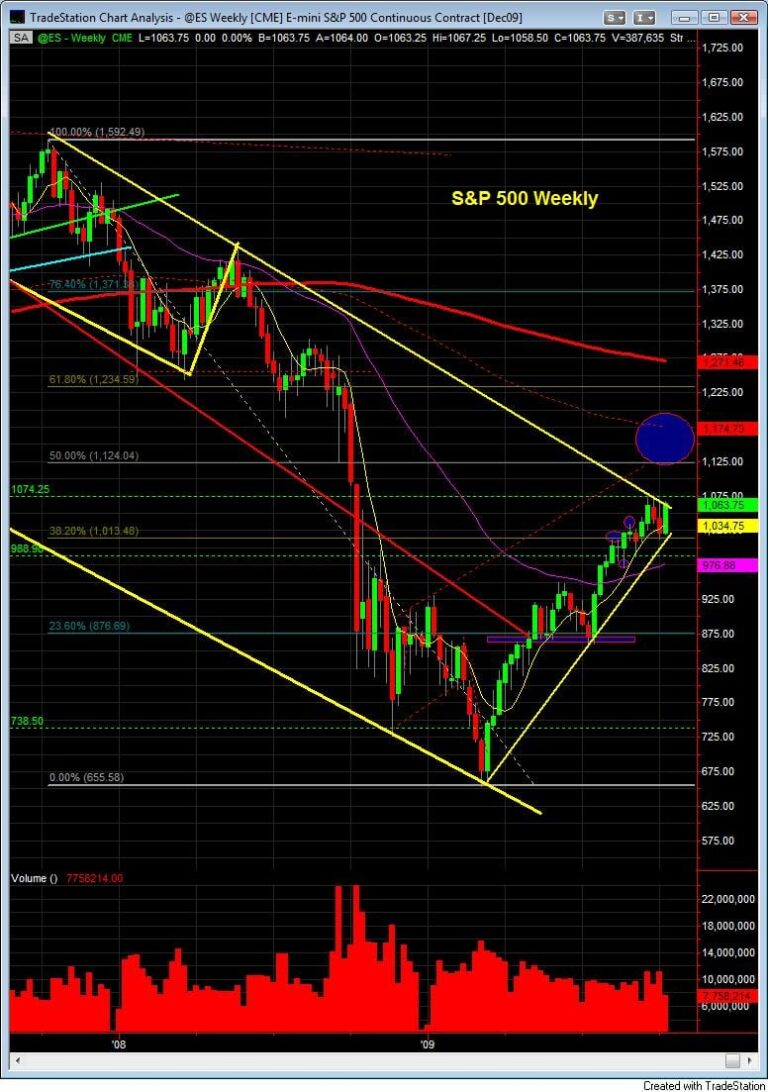
Watching for a mid term double top on the S&P 500 emini futures. seems that we came back up to the previous high with less volume. Presently there is a 48.75 range which is lower than the average.
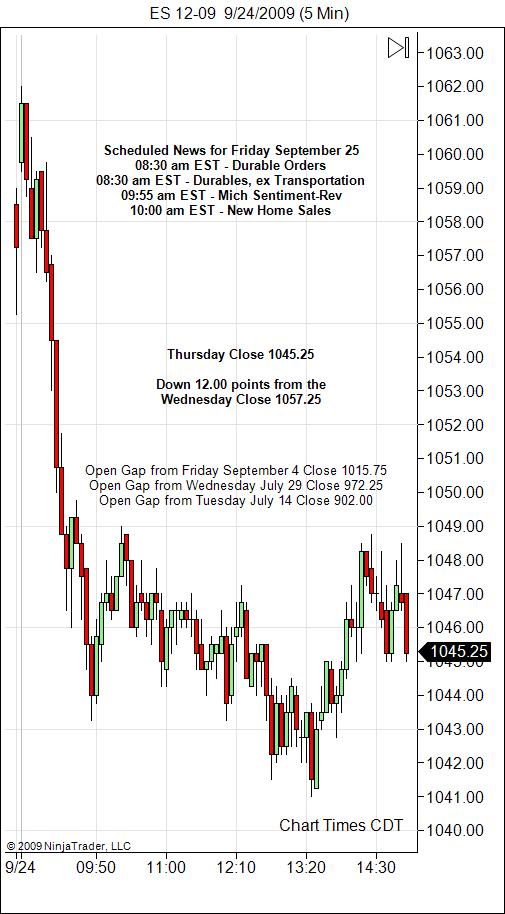
Market reaction to the 8:30 jobs report was rapid. The high for the day of 1062.00 printed in the first 5 minute bar, then a sell off began. By 10:45, most of the day’s move had happened. A descending 3-4 point deep trading channel developed over the next 3 hours and dropped the index another 2.25 points to the day’s low of 1041.00.
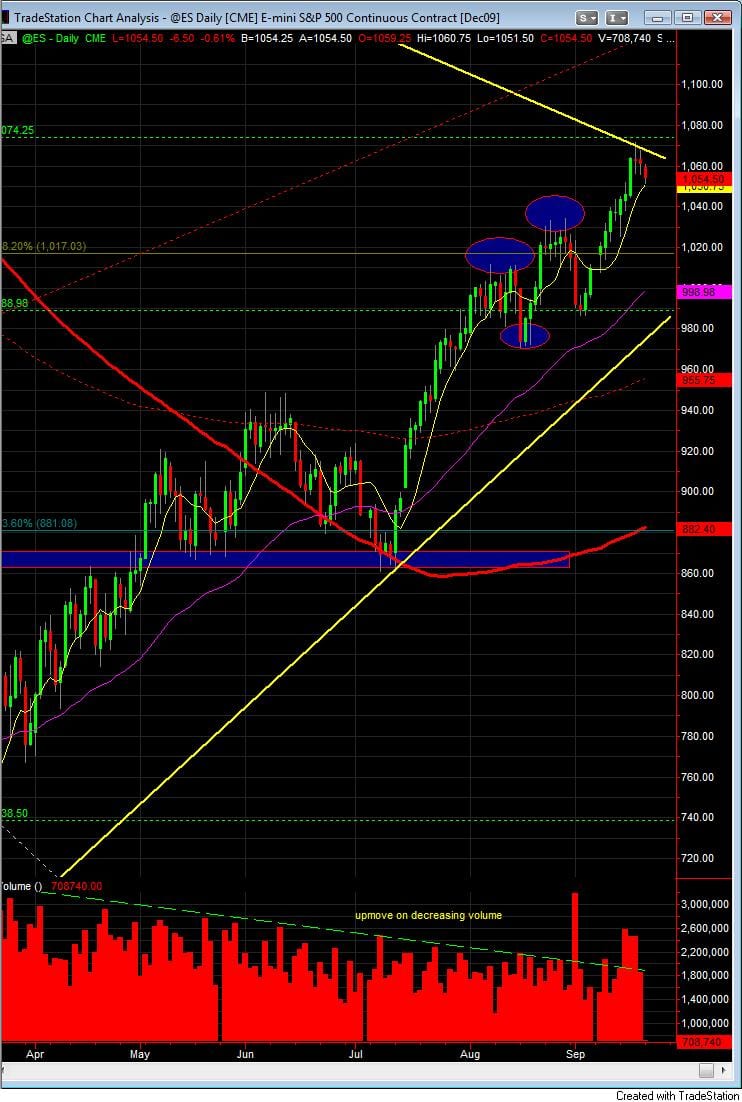
S&P 500 day trading daily chart for Sept 21.
Testing resistance. Probably be in top side consolidation with a test down to give us a chance for more buyers to step in. Could be stepping into a narrow range for trading this week until new direction is determined.
Sign up and a trial link will be sent to your email.