
economy | Emini futures live trade room | S&P 500 | S&P 500 day trading | S&P 500 day trading course | S&P 500 live room
Monday April 20, 2009 S&P Emini 500 Gap
Friday April 17, 2009 Emini S&P 500 Close 866.00
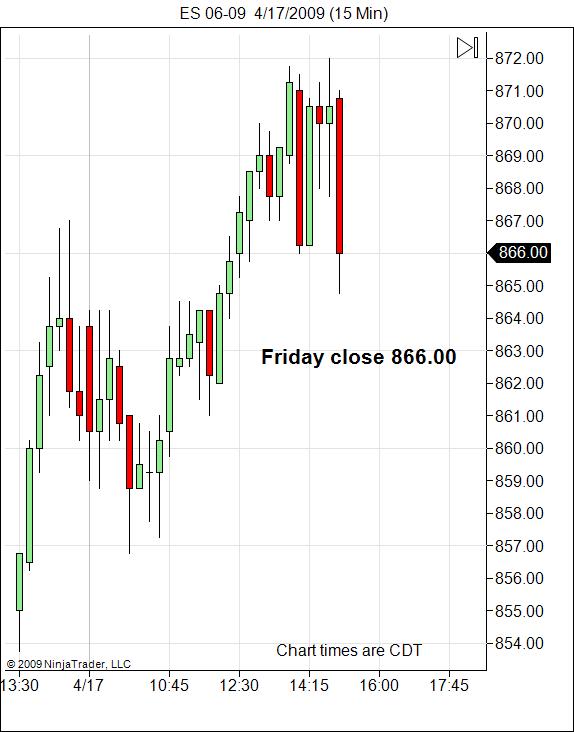
Friday April 17, 2009 Emini S&P 500 Close 866.00
We are looking at the Daily chart for April 17. We are focusing on the price action bringing us to this level. How to read the price action with out indicators and to see if there will be a signal for the break down. A few clues for you to see it and how to integrate it into your trading .
Upside target is 875-83 if we break above then there is a chance of more topside consolidation and then a rollover.
S&P 500 emini futures day trading room.
We are looking at the same levels as Monday. We are consolidating at the top here with no commitment to the downside. We haven’t tested to the 875 level where I am expecting a bit of resistance and then more consolidation to lure the investors that haven’t moved in to the market yet. These are the investors that fear they could be missing the boat, and basically will be sold into. Probably off of more financials recieving money, rolling their write downs together with their TARP money. Makes for a wonderful balance sheet.
Sign up and a trial link will be sent to your email.