
S&P 500 day trading course Oct 26 daily chart
S&P 500 day trading chart Oct 26. Looking for a slight re tracement and then move to a lower high in mid November.
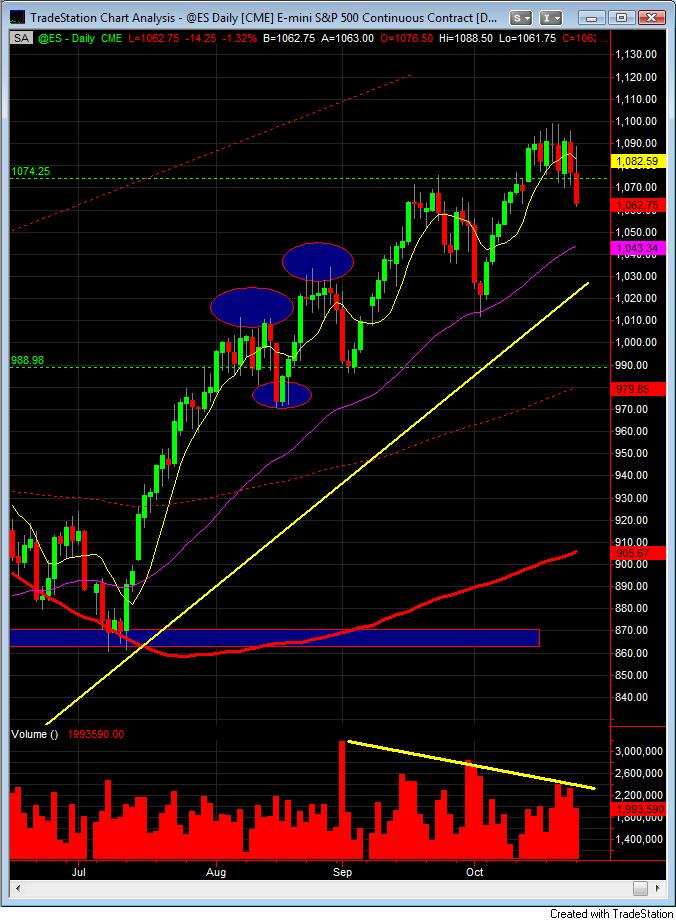
S&P 500 day trading chart Oct 26. Looking for a slight re tracement and then move to a lower high in mid November.
Best trading course S&P 500 emini futures day trading course. Volume dropped off to 1.9 million today after yesterdays 3 million plus. Hopefully the market will face the piper on some of the valuations in equities and get this cleaned out in the third quarter. September is known as the worst performing month on the indexes and it has basically started off with the kind of direction to propel the markets lower. Lots of support here, but for how long?
The S&P 500 is staying in this consolidated range. Looking for it to break to 1049 area if there is a commitment on the buyer side. There is a bit of support under our point of control.
Sign up and a trial link will be sent to your email.