Day trading course- Market at major decision point
Day trading course
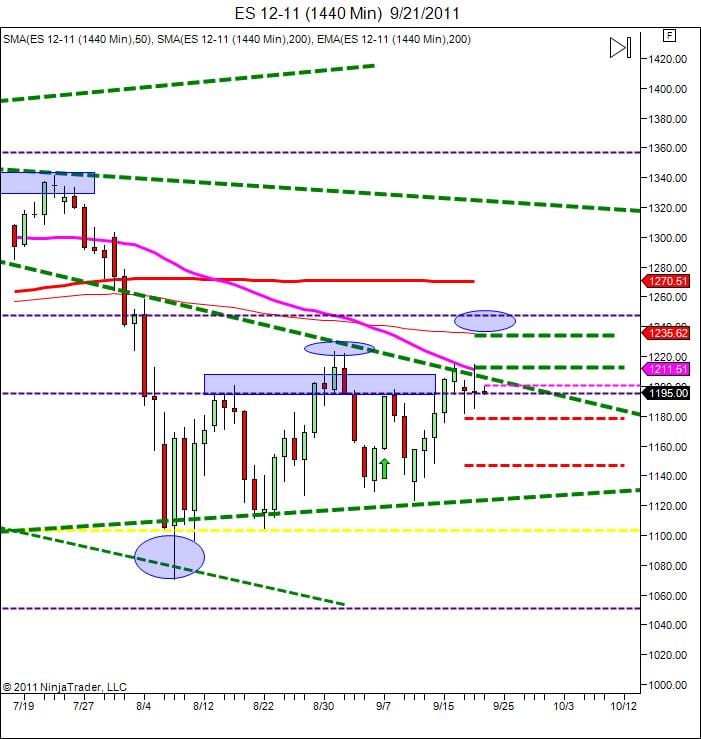
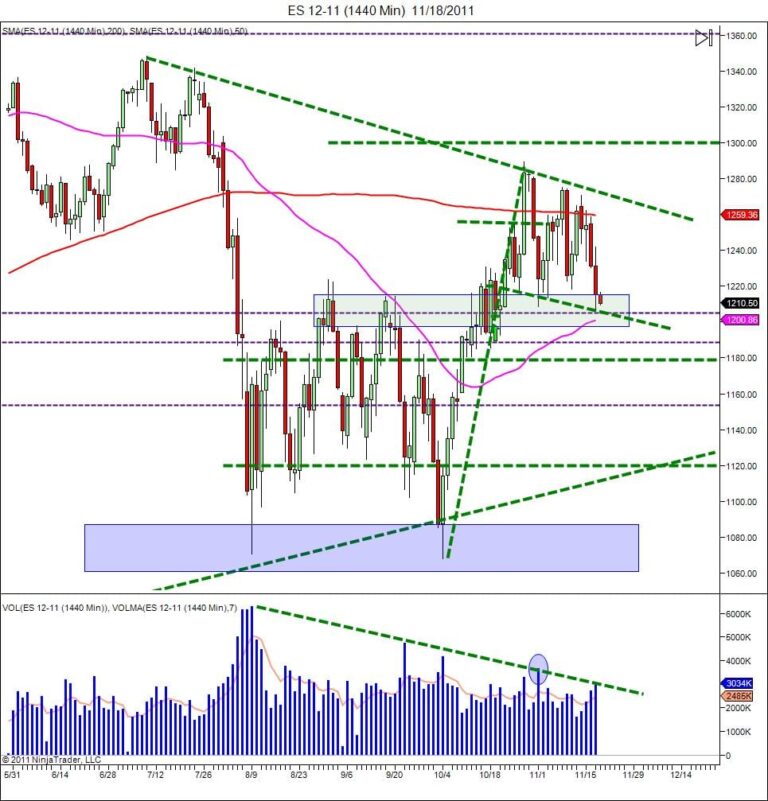
Looking at the structure of this Bull flag, or an ABCD Butterfly, or an inside W on a bearish channel. We can see that if the area to 1180 is supported for an extreme low, then a possibility this next week of a rally to 1320 and then a move onto 1410. This will be putting the market into a further ABCD pattern to the upside and a continuation to the previous swing highs on a monthly chart. This is a very long term projection but in the near term the bullish flag with a sell side head fake could be the signal we are waiting for to rally into this fourth quarter for bonuses!