
S&P500 day trading course mid day head and shoulders
S&P500 day trading course
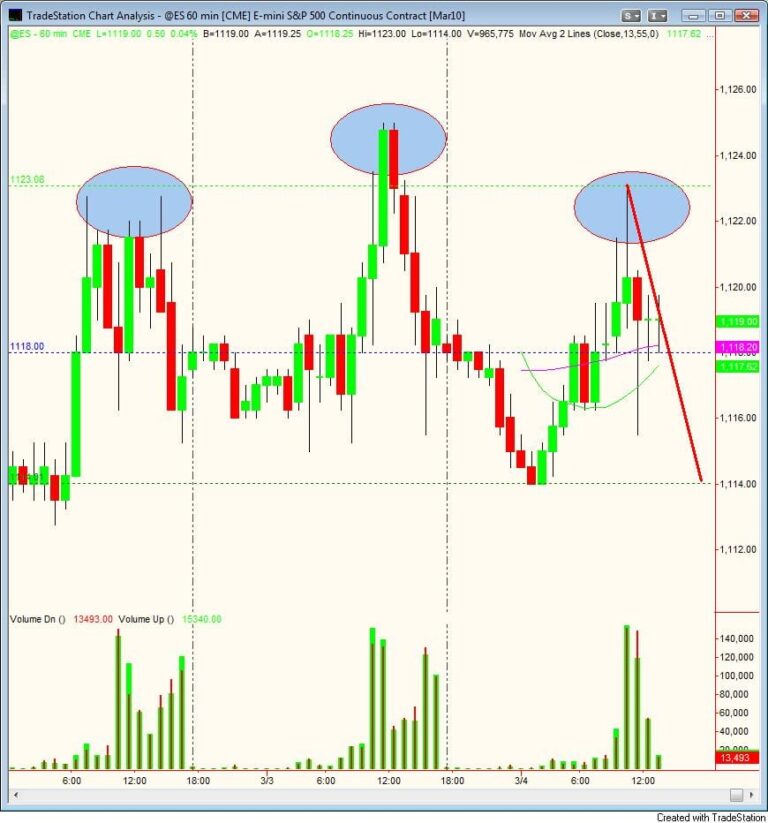
looking at a Head and Shoulders on the hourly chart.
We are caught between 1118 and 1120, in long term consolidation.
S&P500 day trading course
looking at a Head and Shoulders on the hourly chart.
We are caught between 1118 and 1120, in long term consolidation.
S&P500 day trading video below. This could be the Lower high on the long term bullish trend. If the S&P500 emini breaks above the 1127 on an hourly chart we could retest previous swing high.

S&P Emini 500 Futures took most of the day to fill this morning’s 3.50 gap up.
Sign up and a trial link will be sent to your email.