S&P500 day trading course NY open charts
S&P500 day trading course live day trading room and charts levels of support and resistance.
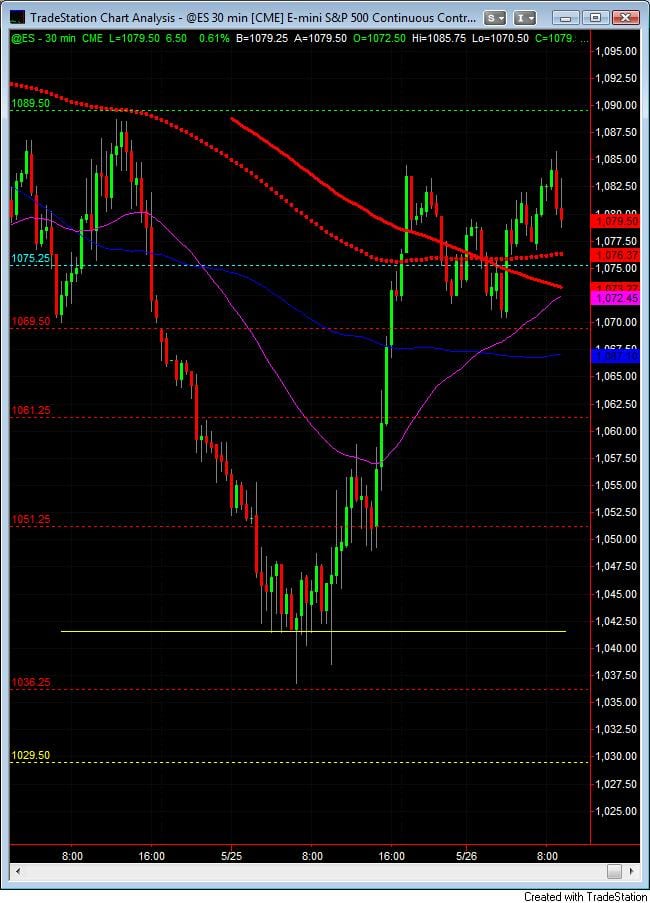
1089-90 is resistance today as we are seeing if the bulls can muster enough of a commitment to get us to 1100. It could be a bit exhausting for them and we could see a sell off if it doesn’t close above these levels today.
1089.50 first resistance
1096.25 next area of resistance
Extreme high of 1105.25
Point of control will be 1075 on the day, I don’t see the bears snatching this away until the close.
1069.50 1st support
1061.25 2nd support
with 1051.25 at an extreeme low. If there is a sell off, would be looking for the previous swing low a 1036.25
Spain has added some volatility to the Euro and expecting a Spanish down grade soon. Watch the lunch hour as London closes.
New to Money Maker Edge? Start here.
Everything on this blog comes from one method: defined risk, a written plan, and live trading with a group. Learn it in three days, then trade it every market day.
The 3-day day trading course · The live trading room · Day trading psychology · Call 866-640-3737