S&P500 day trading course daily chart price action
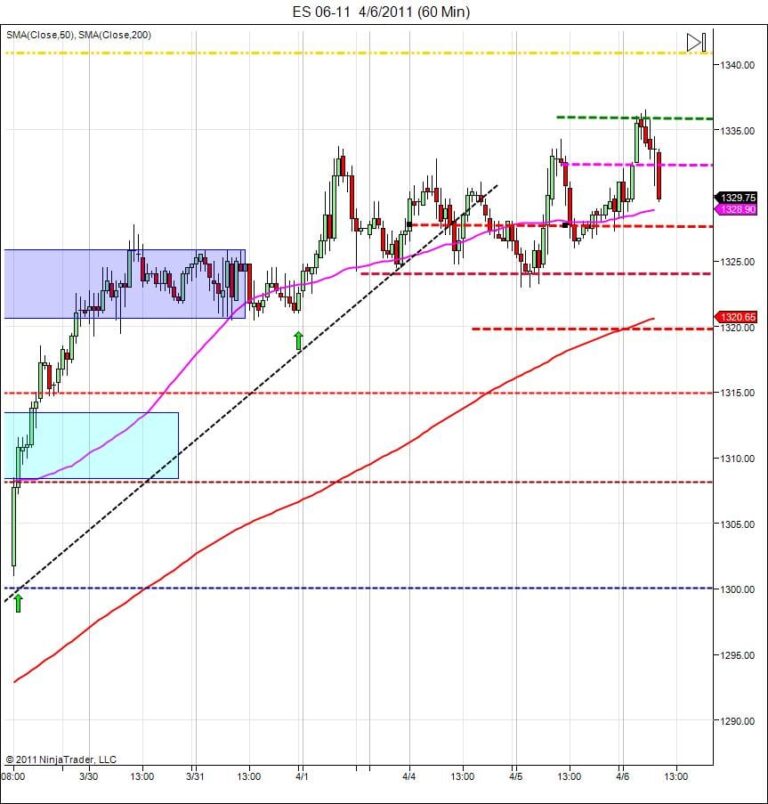
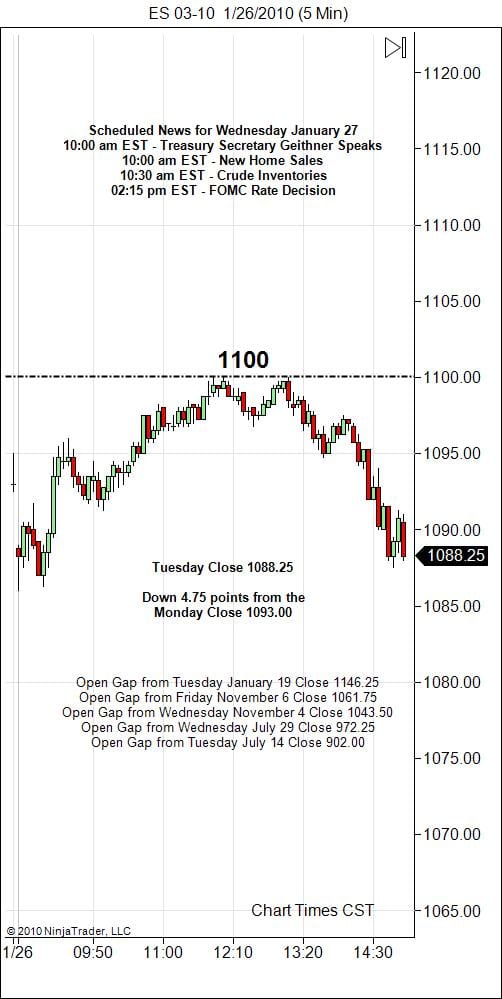
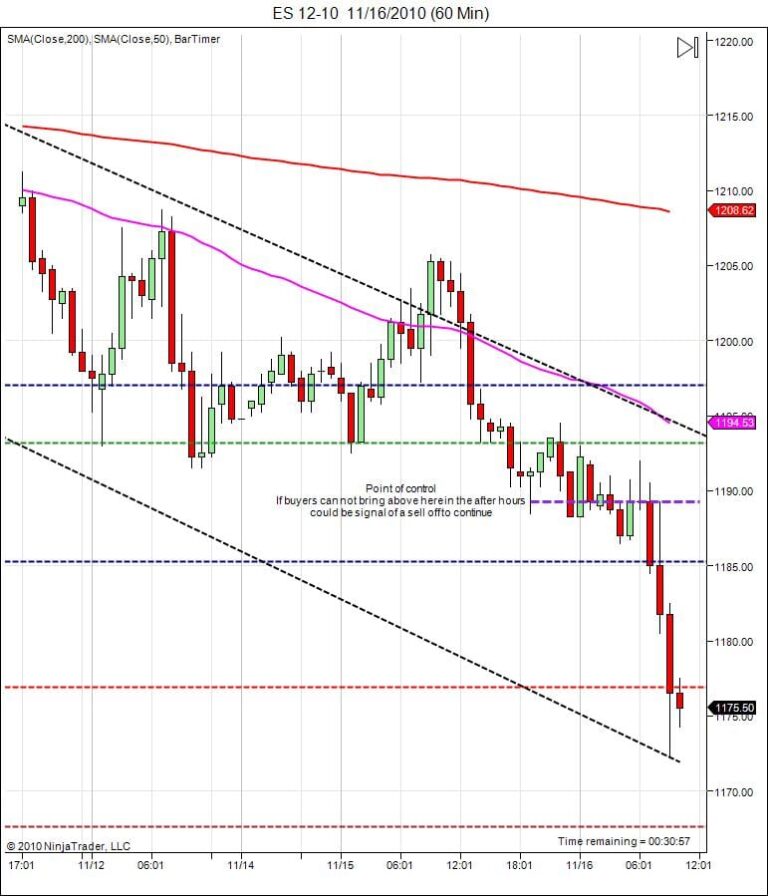
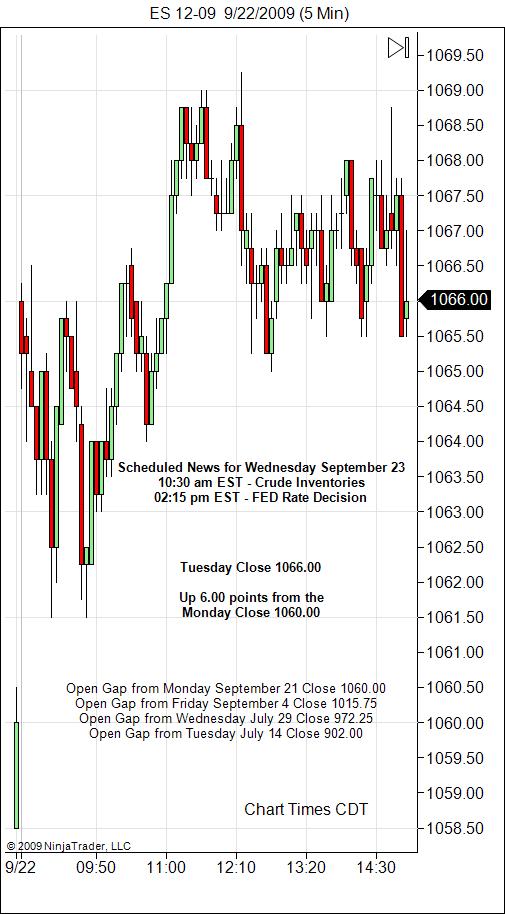
S&P500 day trading course daily chart price action for trade date Oct 18. Looking at the S&P500 emini futures contract. Buyers and sellers are at a practical stand still testing direction and either finding a top or pushing for a break of support. Most of the time ending a few points away from the open.
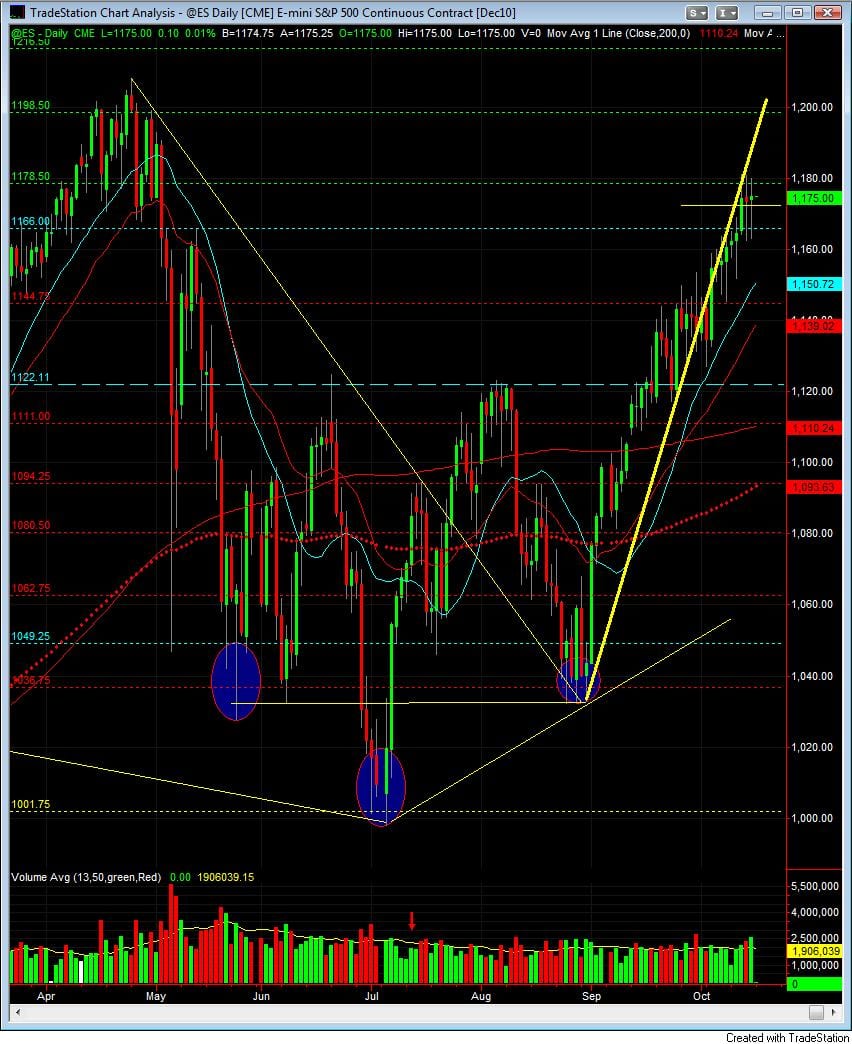
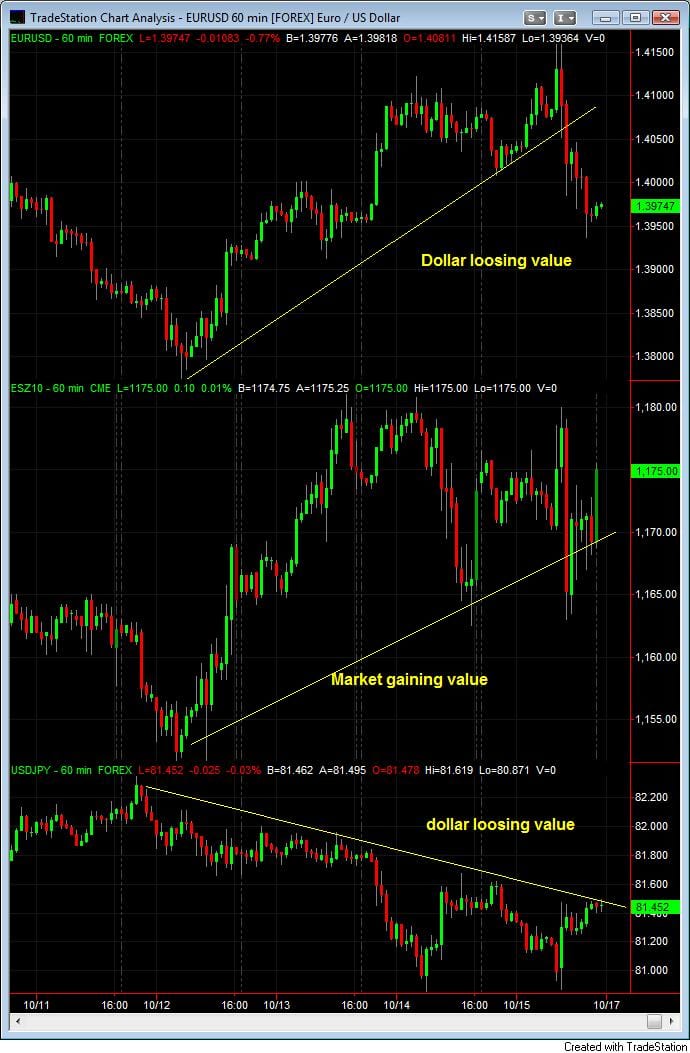
The past three trading sessions have seen a move up with closings near the 1st moves high of 1174. We have been testing both directions with 20 point ranges. Unfortunately, most of this move has been created with the devaluation of the dollar to other currencies which can be seen in Gold and Oil.
Looking at the EURUSD you can see that the dollar is loosing ground quickly and we have a relatively strong move up in the ES. Same with USDJPY.
We might expect to see inflation creeping in from here.
New to Money Maker Edge? Start here.
Everything on this blog comes from one method: defined risk, a written plan, and live trading with a group. Learn it in three days, then trade it every market day.
The 3-day day trading course · The live trading room · Day trading psychology · Call 866-640-3737