May 12, 2015 Weekly trading plan SP500
May 12, 2015 Corona, Ca Weekly trading plan on the S&P500 emini futures with weekly chart, daily chart and a look at the effect of weekly long term price targets and range are in effect.
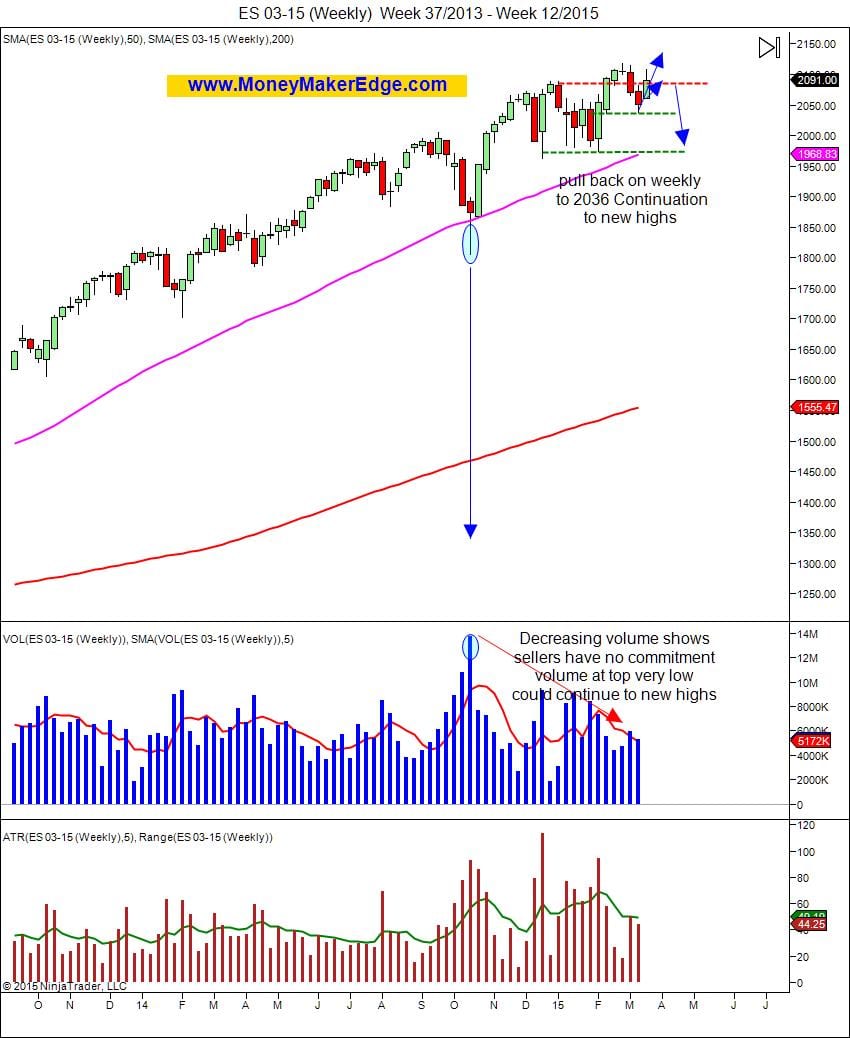 Price action on the weekly chart can be seen in many areas, first by looking at the candle stick and seeing the range from the high to the low which this past week was 44.25 points, just under the 49.10 average range for the past 5 weeks.
So what does this mean for our weekly trading plan?
The previous three weeks sellers moved in and brought price down to support at 2035, then this week the buyers have moved in bringing price to a high around 2108. We broke through the resistance at 2073 and 2084 on the daily chart and clears the way for a test to previous swing highs of 2018.
Looking at average range of 49, for the past 5 weeks with a decrease in volatility, this would tend to show that the high we could reach this week from a low of 2060 is short of the high at 2109 projection. Volume is increasing which could effect the range as when weekly volume increases there is a tendency to see larger price ranges. We are going to need more volume commitment from the buyers to see this break to new highs. If we see buyers moving in on increased volume we would look to buy the dips for our weekly trading plan after we see reversal patterns from last weeks sellers control.
Daily Price Action on the S&P500 emini futures contract for this week.
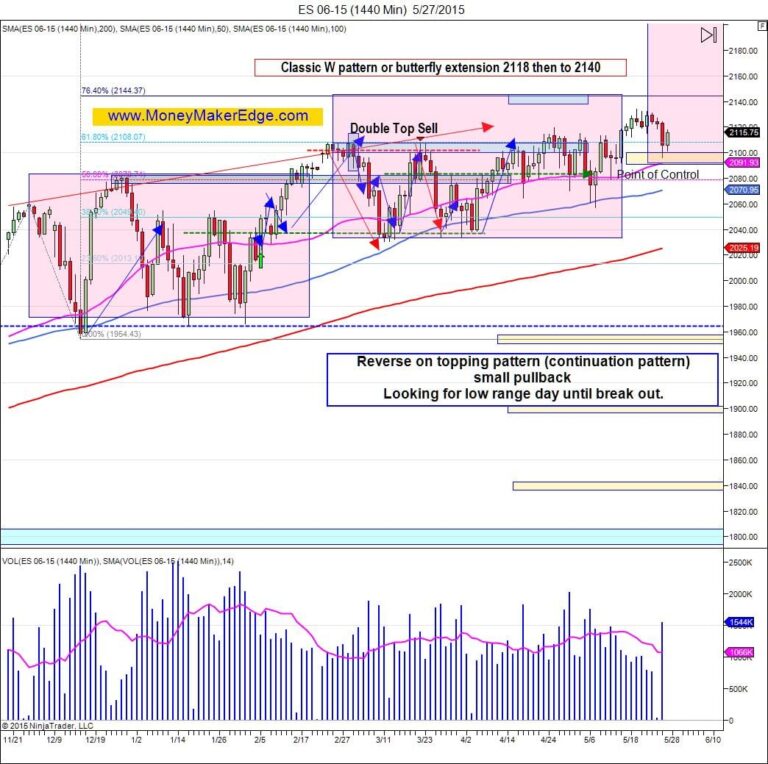
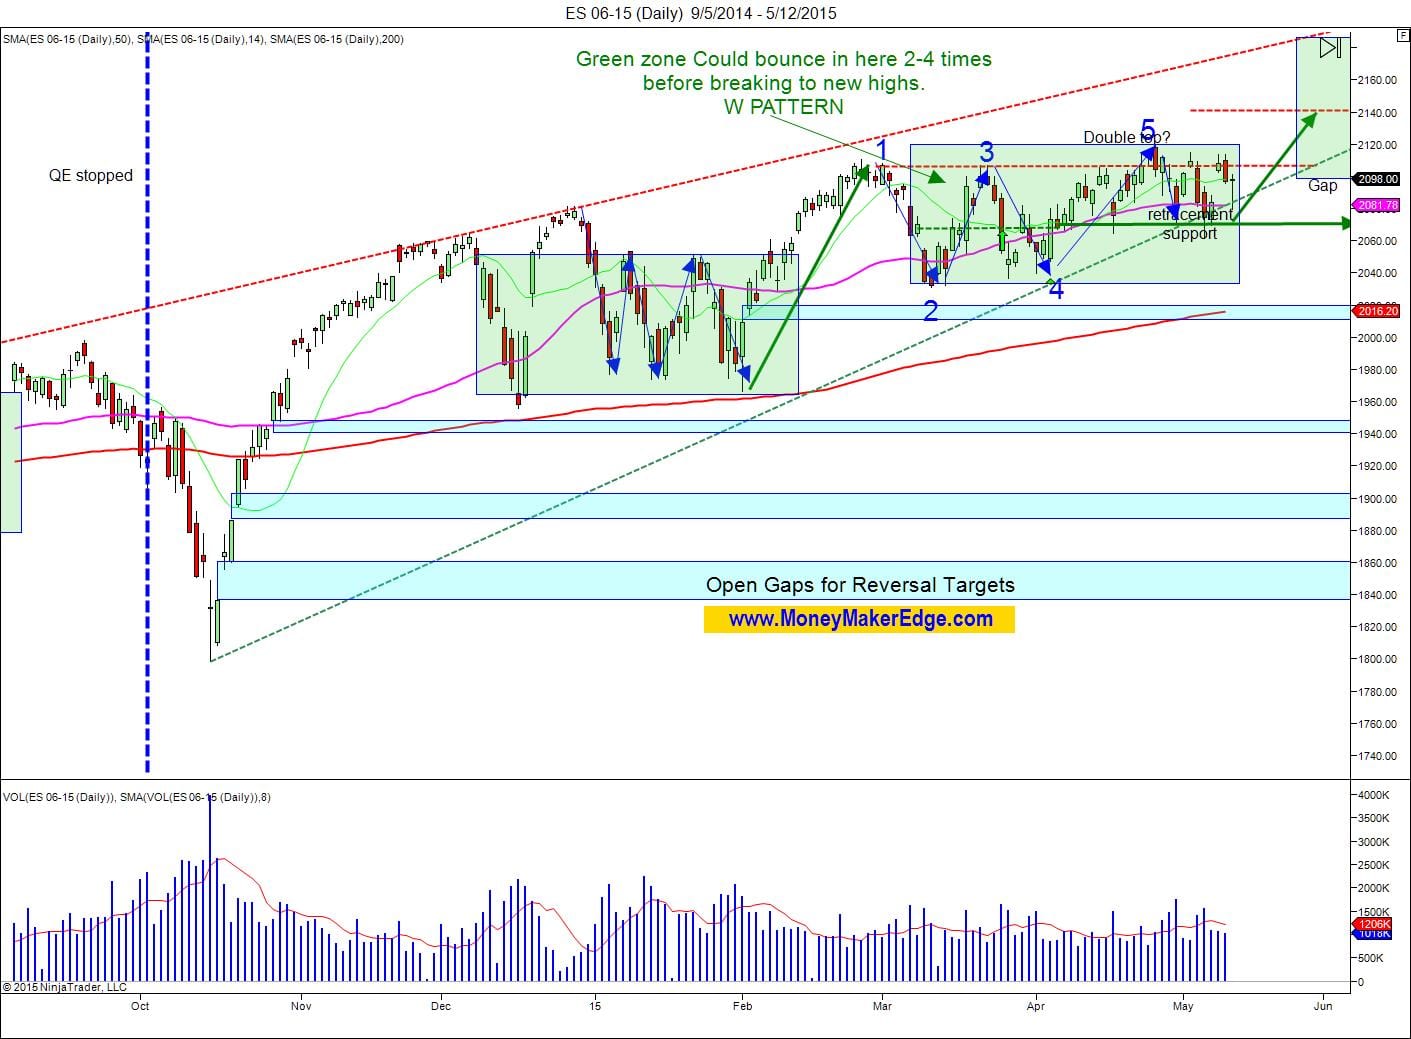 The daily chart on the S&P500 emini futures contract is showing buyers moving in to control after Monday’s loss of control to the sellers. The bottom was confirmed in this move with the touch of the trend line at 2081 which is the 50MA. If the day ends in a doji or a buyers hammer (where price closes higher than the open), then we will look for a continuation of this short term bullish trend in to the week.
You might note that the equidistant green box is coming to it’s end and we are about to enter the next phase of the move until the next green price projection box. We don’t know if price will close another gap at 2012 and confirm off of the 200MA, or if buyers will stay in control taking it to new highs. The equidistant move would be a projected high of 2140 which is the mid point in the price projection box for the next consolidation period.
Remember to do your own analysis, and if you are following the crowd you might be falling into a market maker trap. Manage your risk first and make a written weekly trading plan. This will allow you to reflect on your own analysis.
New to Money Maker Edge? Start here.
Everything on this blog comes from one method: defined risk, a written plan, and live trading with a group. Learn it in three days, then trade it every market day.
The 3-day day trading course · The live trading room · Day trading psychology · Call 866-640-3737