Forex Day Trading Forecast AUDCAD for 16-01-2017
Forex Day Trading Forecast AUDCAD for 16-01-2017

Forex Day Trading Forecast AUDCAD for 16-01-2017
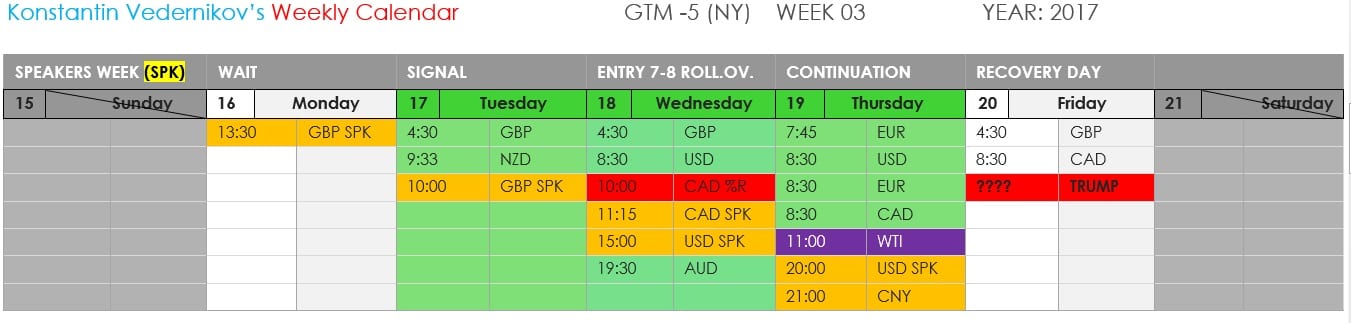
This week won’t be easy to trade.
With 6 speeches on almost every major currency, market will be quite volatile and uncertain. After looking on market, there’s few pairs to not touch, such as :
- GBP : Because of the GAP, and oversold area, it will probably fall in volatile consolidation.
- JPY : Look like it’s selling, but I don’t like it. Sellers are weak, and they losing strength and I don’t see buyers catch it up.
- USD or EUR , they moving in correlation those days, probably waiting for the 20th January for Trumps 1st Presidential day.
What left?
- CAD : Because of the important news on “interest rate”, Wednesday. And it look like, Crude Oil are going Long for this week.
- AUD : Because of Gold hitting important resistance, show weakness and looking to retest last lows.
- Important: CAD & WTI and GOLD & AUD , correlation are about 90% positive.
- Then, if GOLD go Down, AUD go Down. If Crude Oil go Up, then, CAD go Up.
- It’s why I focus this week on shorting AUDCAD.

Let’s Plan our trade on AUDCAD for this week.
But 1st! let’s look on GOLD and WTI , to make the best decision for this week.
First let’s look at Crude Oil chart from daily to 4hours time frame.
What should you see and understand?
- Daily chart: We are right on a major resistance and market doesn’t know where to go.
- 1st 4h chart: Look like Market Maker keep Oil price Up. For long term.
- 2nd 4h chart: There’s a formation of Inverted H&S. This momentum will break the down trend.
- Conclusion, WTI looking to go Up, then CAD should also go Up.


Now let’s look at Gold chart from daily to 4hours time frame.
What should you see and understand?
- Daily chart: this it’s a great pattern of “Dead Cat Bounce”, one of my favorite. a Clear signal to short.
- 4h chart: Short a clear signal, of buyers making last move. You can Sell now, or wait for confirmation.
- Conclusion: If Gold going down, AUD could also drop. And it’s why I chose for this week AUDCAD Short.


Let’s look on our daily chart, see if there’s any possibility for shorting AUDCAD?
As you can see, AUDCAD look like “Gold daily Chart” above. This is due to high correlation between both. But you may ask…should I short AUDCAD , when buyers was quite strong on last move, week.
This it’s a great question I did ask my self too…and I decide, for this trade it doesn’t matter who was in control last week.

Long term Support and Resistance for AUDCAD
By looking on my weekly AUDCAD chart, I realize , in this specific range, price can jump, Up and Down, in few days. This it’s why , I don’t care that much about last week movement. In fact, if in this range, price moving from top to bottom, from week to week, this it’s a great news for us, my short trade have more probability to happen, than to see market keep moving up.

Let’s find our Entry point, Calculate our Risk, and find out when to enter.
On short term, AUDCAD show weakness, it confirm us the short trade. They bad thing…right now, I see no clear entry point.
My recommendation:
- First option: Put your order at the top, and stop above it. then, wait…and let it go till Friday.
- Second option: Look for entry around 4h00am and 12pm New York Time on my “entry day”.
- Third option: Wait for the break out, and if price go back to the “break out price” ( “dead cat bounce pattern”) , then buy, and let it go.


Thank you readers, comments or ask question if you have some.
We love to help with your trading success.
KV
New to Money Maker Edge? Start here.
Everything on this blog comes from one method: defined risk, a written plan, and live trading with a group. Learn it in three days, then trade it every market day.
The 3-day day trading course · The live trading room · Day trading psychology · Call 866-640-3737