Day trading course l 866-640-3737 l learn how to daytrade l Day trading education
Trading the S&P500 emini futures contract in the S&P500 day trading course live room.
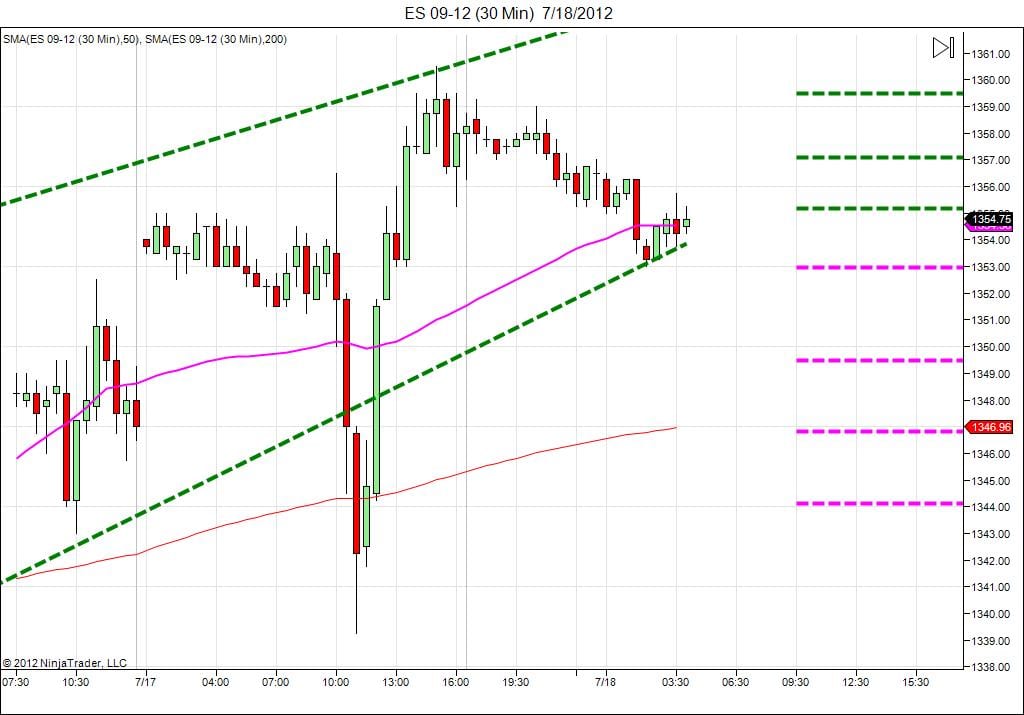
A bullish trend with a very strong test to the downside earlier on 7/17 piercing and breaking through the bottom trendline of the channel. Support was found at 1339.25 with a retraction to the former range and continuation of the the bullish channel.At this time testing the lower trendline, support is holding.
If support breaks and sellers come in price will breakthrough the lower trendline and head towards the first target at 1353. If bearish pressure is still strong next targets of support are 1349.50, 1346.75 and on down to 1344.25.
If support holds buyers will come in to push price towards the upper resistance at top of the channel. The first target is 1355.25. The next targets of resistance being 1357and 1359, on the way up to the upper trendline.
Trade What You See
New to Money Maker Edge? Start here.
Everything on this blog comes from one method: defined risk, a written plan, and live trading with a group. Learn it in three days, then trade it every market day.
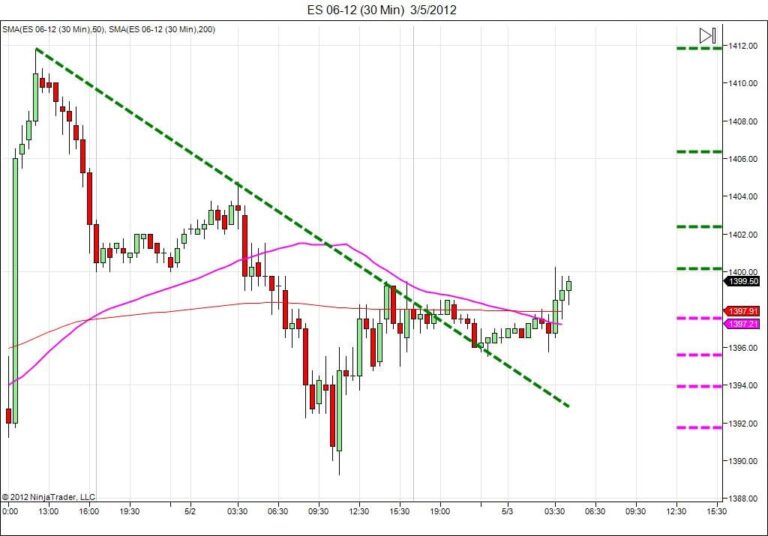
Day trading course l 866-640-3737 l learn how to daytrade l Day trading education Trading the S&P500 emini futures contract in the S&P500 day trading course live room. There is a wide range and consolidation between support at 1390 and resistance at 1411.75. After the rally up to the peak at 1411.75 there was a…
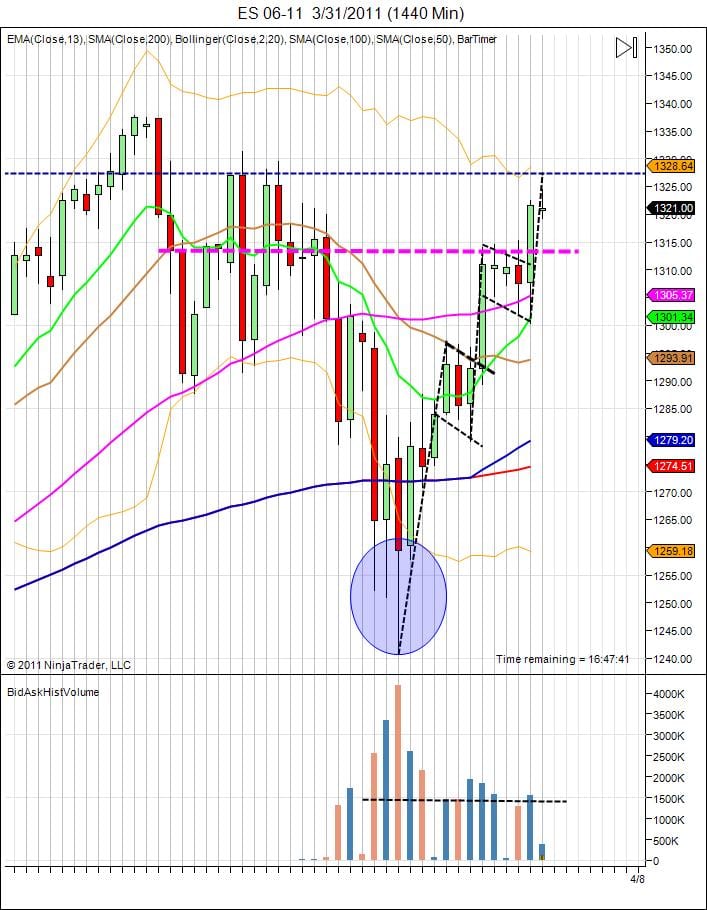
day trading course S&P500 daily chart Off of the previous swing low we see price failure and a move up to 1393. We are seeing a series of bull flags that are pushing us to previous swing highs.
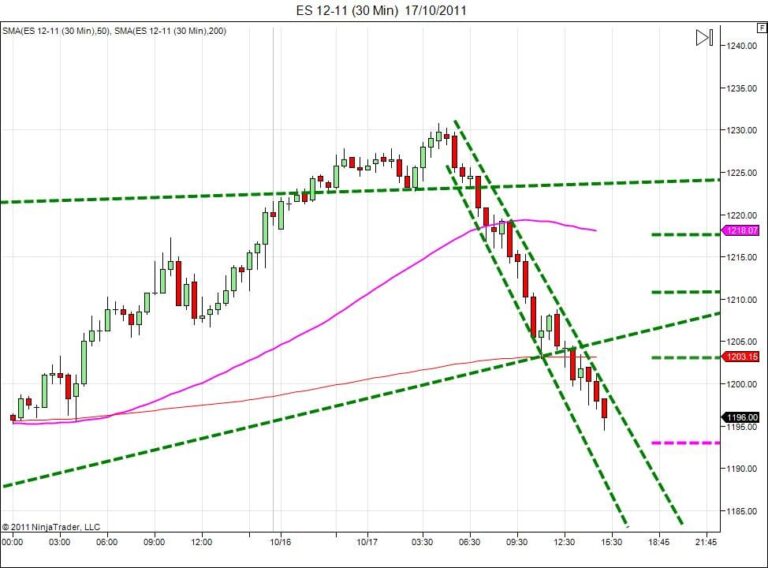
Day trading course l 866-640-3737 l Day trading education Trading the S&P500 emini futures contract in the S&P500 day trading course live room. The bears have just been dominating all day driving the price down from the high at 1226 to the present price point at 1195.25. The price is hanging around in indecision at 1195 to…
Day Trading Dow Jones Industrial Average DJIA 1928-1929 chart and 2013-2014 chart Market are definitely in a very stressful pattern.with this chart that most of people saw, there’s some question people are asking them self, should you sell or keep buying since we are in Up trend. What people may don’t see, is what happening…
AUD USD Forecast | Forex Day Trading | Trading Strategies Forex Risky to trade AUD USD for next week. What this video to know why. Learn How Buyers lost they money on last move up by Sellers. https://www.youtube.com/watch?feature=player_embedded&v=Gzt2rS2v4DM AUD USD Forecast | Forex Day Trading | Trading Strategies Forex New to Money Maker Edge?…
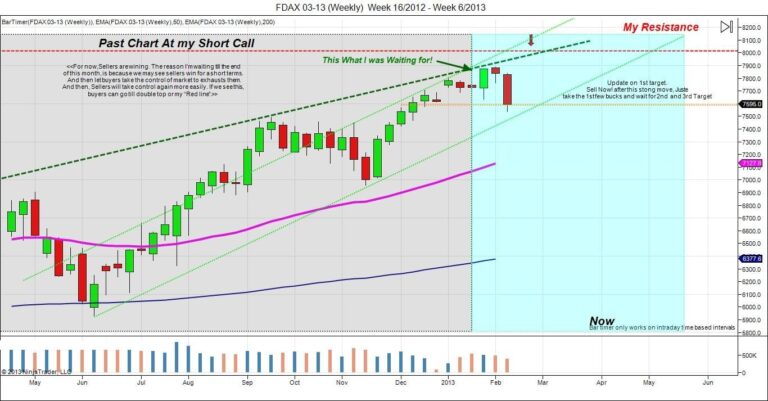
Day Trading DAX Index Chart on(FDAX): Hi Traders, this is just an update for 1st target, and also, result of my work on DAX Index, ( FDAX futures). Like I mention, I was waiting buyers get exhaust before shorting DAX. We din’t have to wait for to long.Sellers are in total control of US$ this week,…