Day trading course l 866-640-3737 l learn how to daytrade l Day trading education
Trading the S&P500 emini futures contract in the S&P500 day trading course live room.
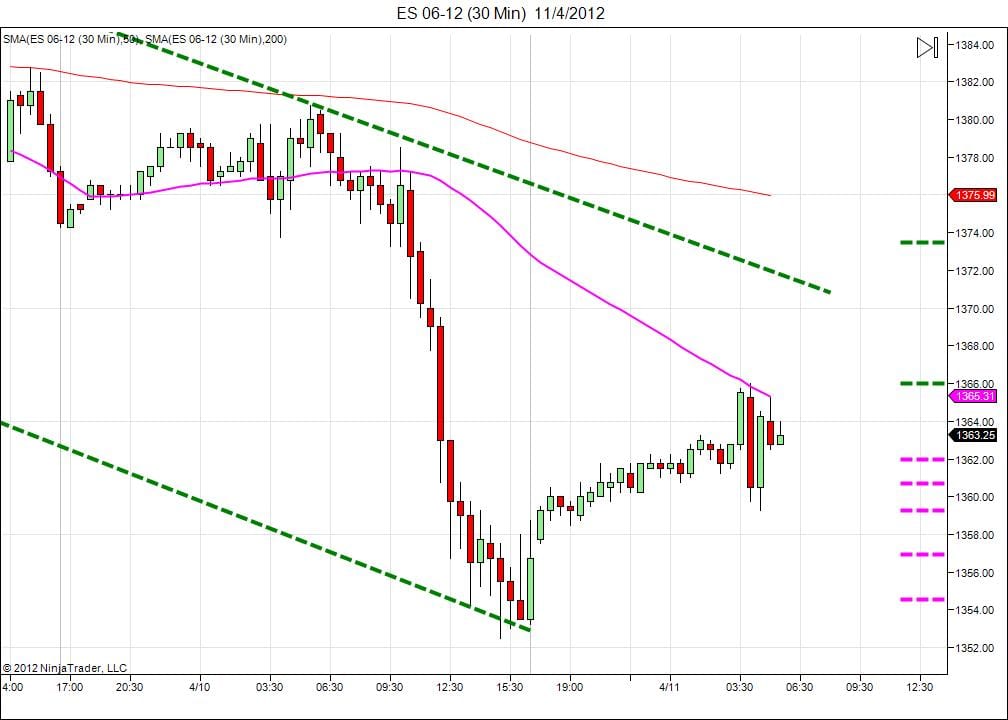
The S&P500 emini was ranging until there was a pierce and breakthrough of support at 1374 with a downtrend to consolidate at between 1353 to 1357. A strong support at the bottom trendline of 1353 prompted buyers to come in and head price towards the 50SMA, to hang around there and test resistance. At this time still trying to test resistance and possibly break through the resistance at the 50SMA.
If buyers pressure breaks through at this level, the first target is 1366. The next target is the top trendline and on to the outer target of resistance at 1373.50.
If resistance proves strong, sellers will come in to pressure the price movement to test support at the first target of 1362. If support breaks, next target is 1360.75, then onto the next levels of support at 1359.50, 1357 and 1354.75, with the outer target of support at the bottom trendline.
Trade What You See
New to Money Maker Edge? Start here.
Everything on this blog comes from one method: defined risk, a written plan, and live trading with a group. Learn it in three days, then trade it every market day.
EUR vs USD Forecast | Forex Day Trading | Trading Strategies Forex US dollars Nice Trade to take on EUR/USD with Low risk on Monday. Both Direction can go, but I’m more short than Long on this one ( Short on US Dollars Index). https://www.youtube.com/watch?feature=player_embedded&v=QIgEtQ-_Jzg EUR vs USD Forecast | Forex Day Trading | Trading…
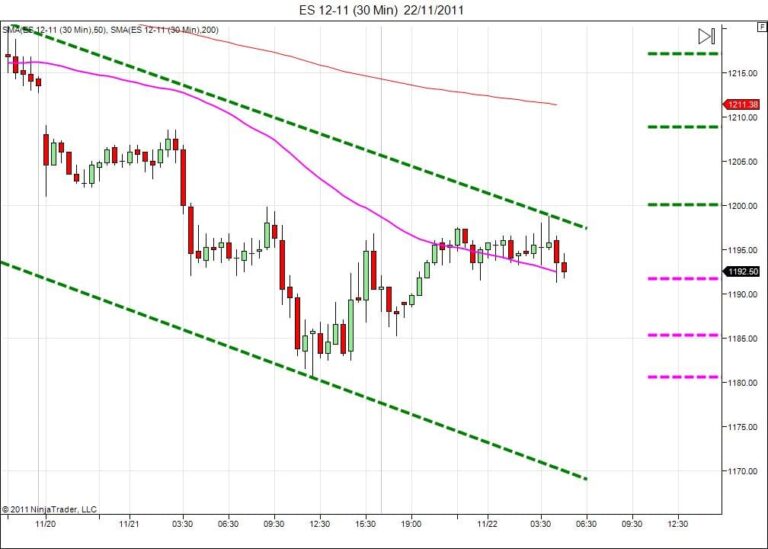
Trading the S&P500 emini futures contract in the S&P500 day trading course live room. Sellers have price traveling down a bearish channel with a touch and test of support at the bottom trendline around 1180.50. Buyers came into drive price up to test resistance at the upper trendline. There is now indecision with some testing…
The markets mirror many natural conditions and environments. This past week we have seen the first group of three class 4 hurricanes in the pacific in recorded history occurring at the same time. Global Class 4 market conditions. There is just so much financial fraud you can inject in the system before the storm washes it…
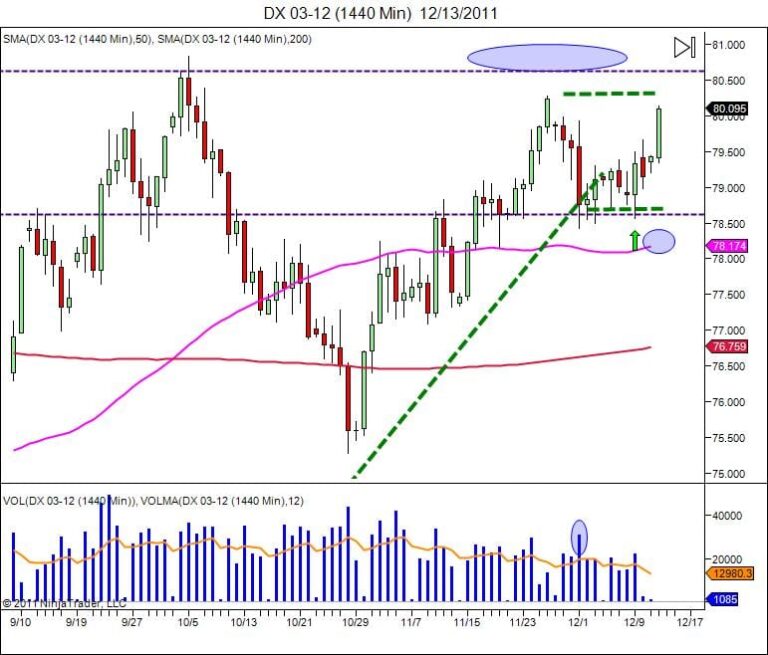
The dollar index is moving towards a double top at 80.28 with another area of resistance at an extreme high 80.82 . This is the double top on a longer term chart. We are using the 1440 min chart for this top to see the after hours movement in the market.
Day Trading Bonds Learn Futures Movement of Bonds. Will sellers break UP Trend, to go back to 200MA? or the bullish trend will keep going? https://www.youtube.com/watch?v=RJfBKTuwDVc New to Money Maker Edge? Start here.Everything on this blog comes from one method: defined risk, a written plan, and live trading with a group. Learn it in three…