Gold breaking Bearish Trend
Gold breaking Bearish Trend
Gold Weekly Chart
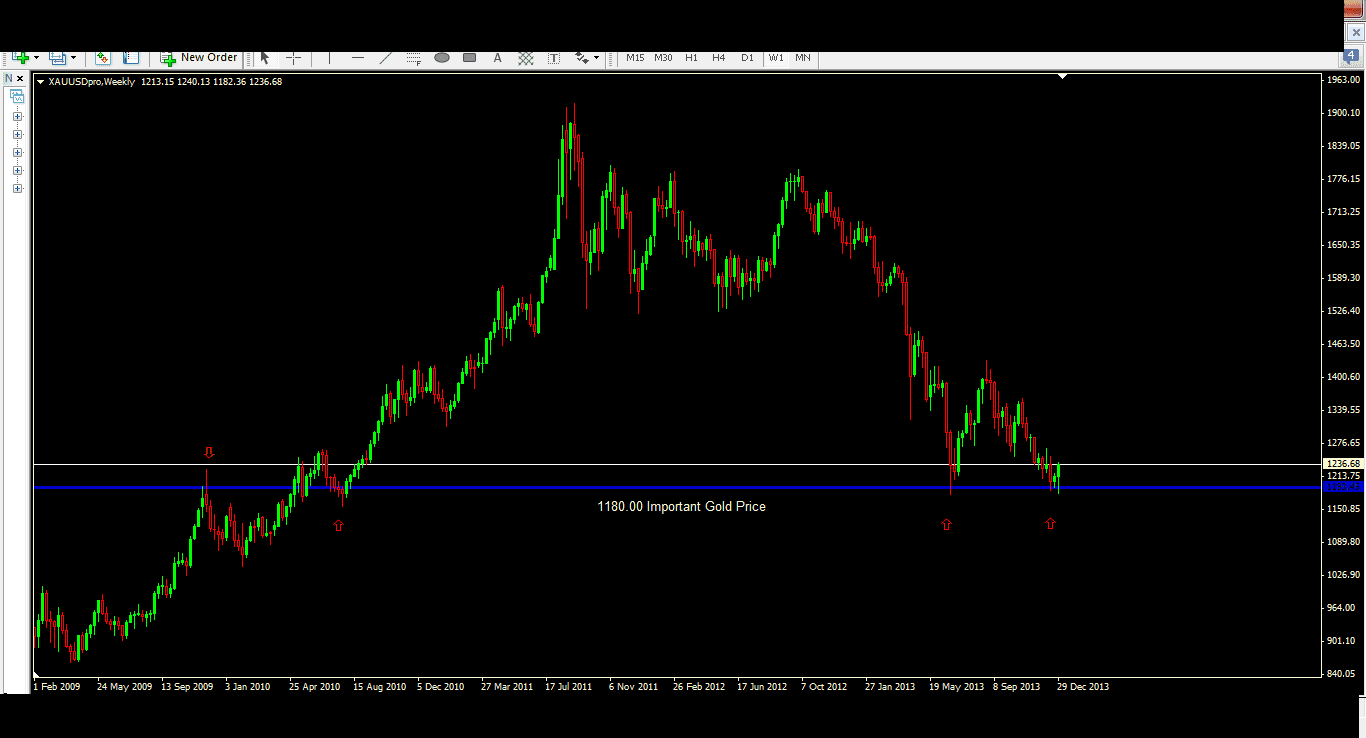
1180.00$ gold price are very important. to see gold go lower, it need to close under 1180.00$. Once this happen, next price target will be close to 1000.00$.
But so far, buyers don’t let seller go lower, and last week, it look like, buyers start to taking control of gold price. For how long? It will be very interesting to watch.
Gold Daily Chart
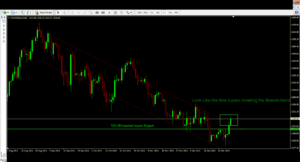
On daily chart, we can see gold breaking bearish trend. After 2 last sellers short, with very good volume, realizing they wasn’t able to go lower, it shows how Buyers are committed to bring gold price higher that it is right now.
For now, the price I’m watching, it’s 1215.00. We may go back, bounce and keep long direction, but it’s important to not close under this price. What then, sellers may be strong enough to break the double bottom.
New to Money Maker Edge? Start here.
Everything on this blog comes from one method: defined risk, a written plan, and live trading with a group. Learn it in three days, then trade it every market day.
The 3-day day trading course · The live trading room · Day trading psychology · Call 866-640-3737