learn how to trade Market
…looking for a consolidation for next week

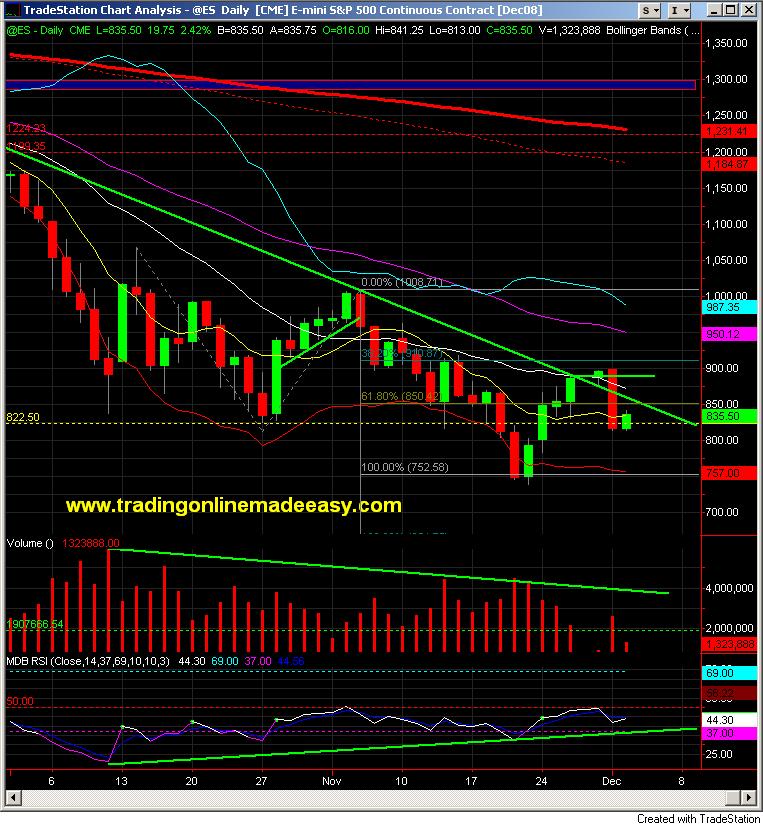
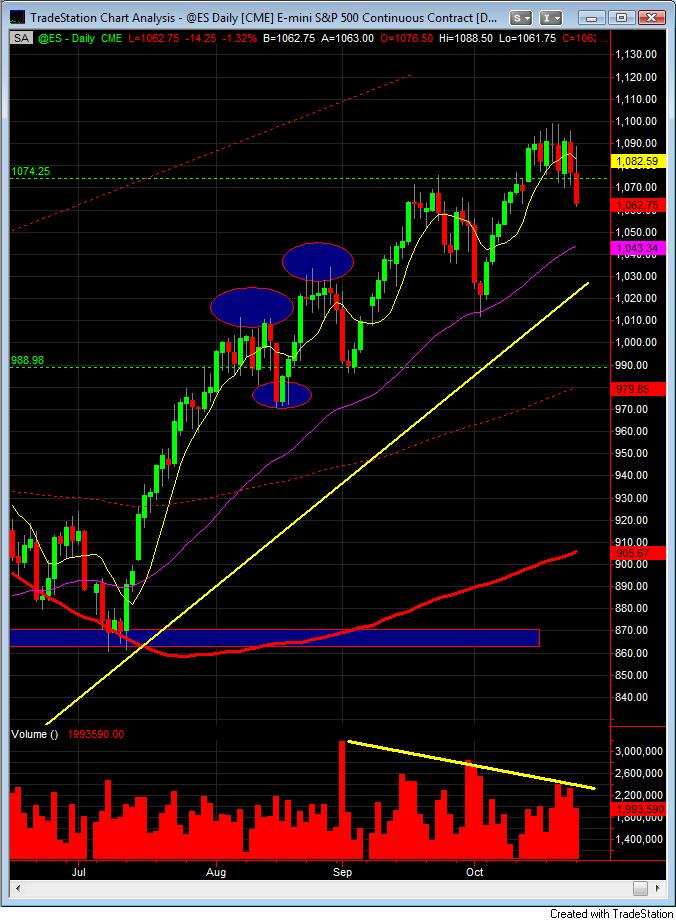
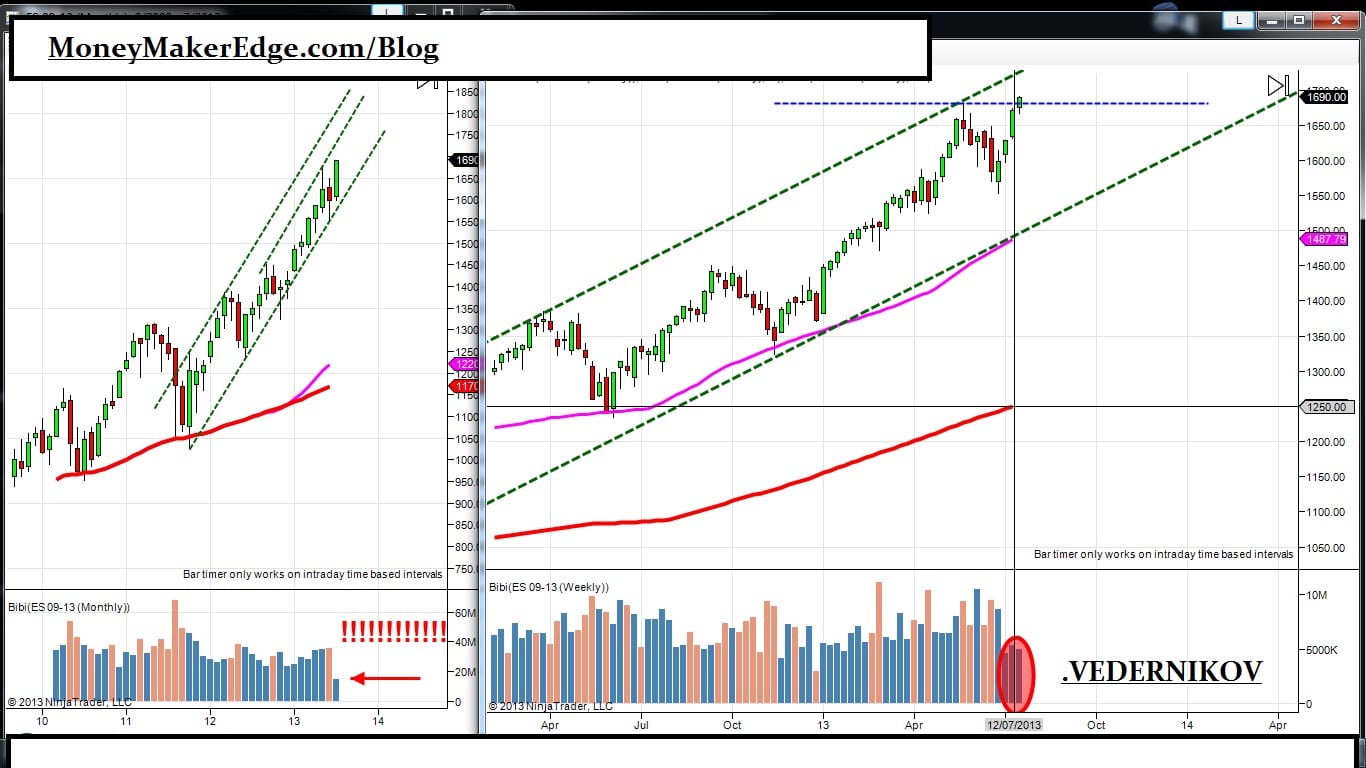
ES E-mini monthly and Weekly, Look on volume level.
Weekly chart:On those charts, you can see, as we was going back to the double top, and even when we pass and close above, Volume did not increase at all. even worst, they decrease.
Monthly chart: 8 business days left to close this monthly candlestick. in 3 weeks, since this month start, we din’t even hit 50% of average monthly volume.

480min chart:
This what make me keep away to trading next week. If you look on 1st Rally and they volume, and compare with 2nd rally and they volume, you may start to catch that something coming.
I’m not short or long…but on hold. Why? well, sellers don’t showing they presence at all, as we hit new double top of all time again. And buyers are able to close above, with lower volume than last time .
I don’t know for you, but for my self, I will wait for a clear direction, to avoid head fake from both side.
New to Money Maker Edge? Start here.
Everything on this blog comes from one method: defined risk, a written plan, and live trading with a group. Learn it in three days, then trade it every market day.
The 3-day day trading course · The live trading room · Day trading psychology · Call 866-640-3737