Oil Day Trading
Oil day trading price update and targets on BRN Charts.
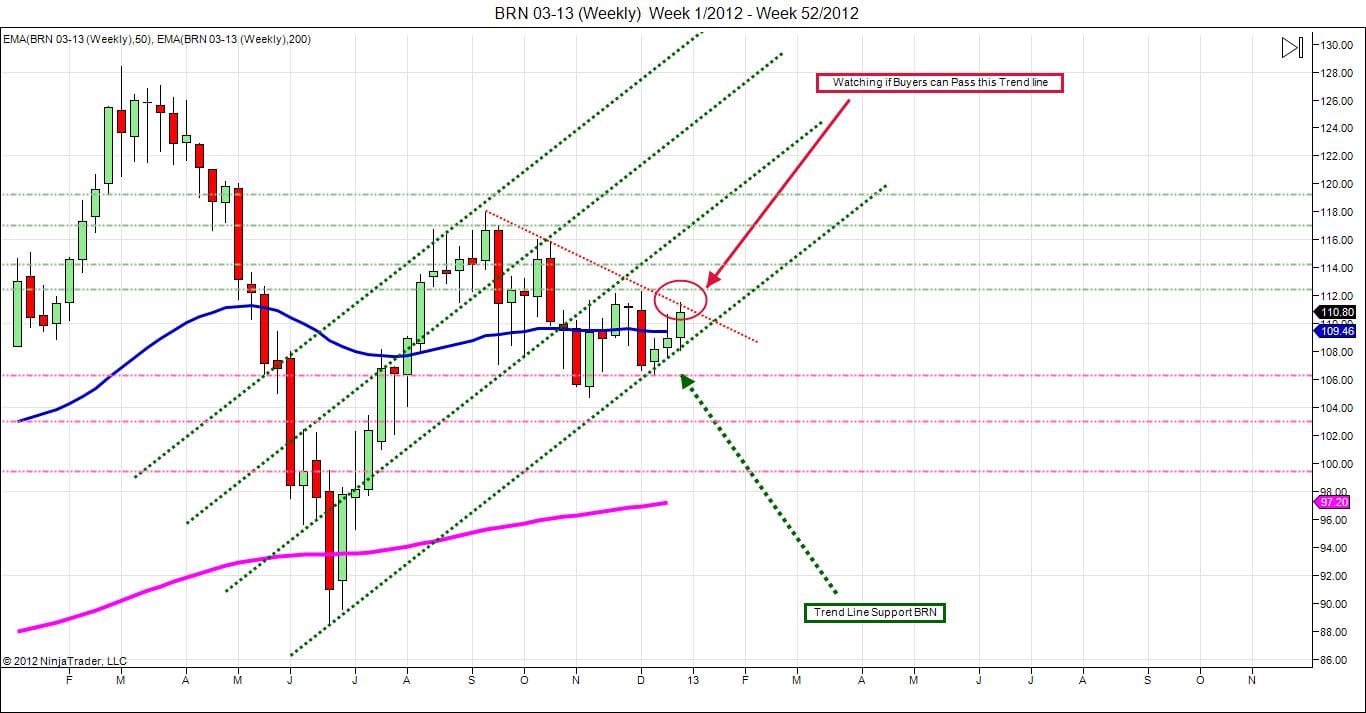
This Chart are 4 Weeks Old, I use it on my old post. As you can see,my green Buyers trend line was useful and did support price at ~111.45 price (red line). And now,this price are supporting Buyers .
I’m looking to get to my second target and a 3rd in few weeks. then we will hit the first double top (3rd target long), and depending on each party commitment, we should get out or keep “long” position.
For next week , if sellers win on Monday, with more than 200k of volumes. We will see a 50% retracement, to my red line. Is possible to see price go down till 100.35 , but buyers should not support this price, and close above ~111.45 (red line).
Oil day Trading Movement of price for next week

This next chart, is an Update for price&target. I add 115.63 (Dark Green line). this is my “3rd” targets. If we don’t pass in one shot and close above 115.63, good chance I will make a new update on BRN /oil price.
Also, Notice 50MA is always a great support or resistance. for right now, it was supporting buyers price all months.
For those who are looking to take an “oil day trading” against wait to get in “weekly trade” at 50% retracement. Make sure you know how to manage your risk, because next week will be volatility.
New to Money Maker Edge? Start here.
Everything on this blog comes from one method: defined risk, a written plan, and live trading with a group. Learn it in three days, then trade it every market day.
The 3-day day trading course · The live trading room · Day trading psychology · Call 866-640-3737