S&P500 weekly chart, learn to trade emini futures.
S&P 500 weekly chart for Oct 9 The economy is not reflected in the Market. Trading fundamentals for the economy is not reflecting in the market place.

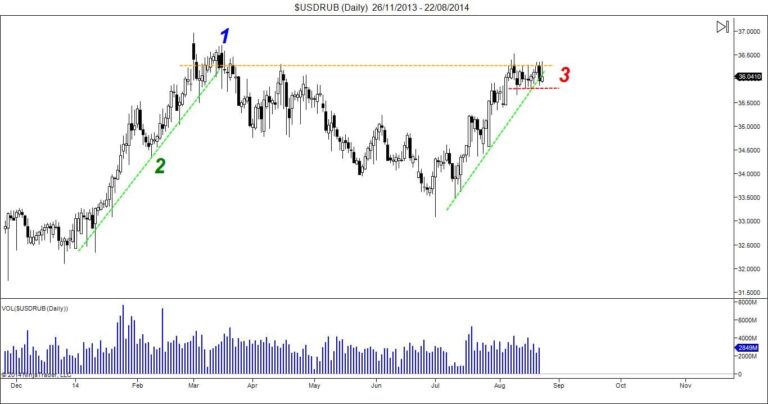
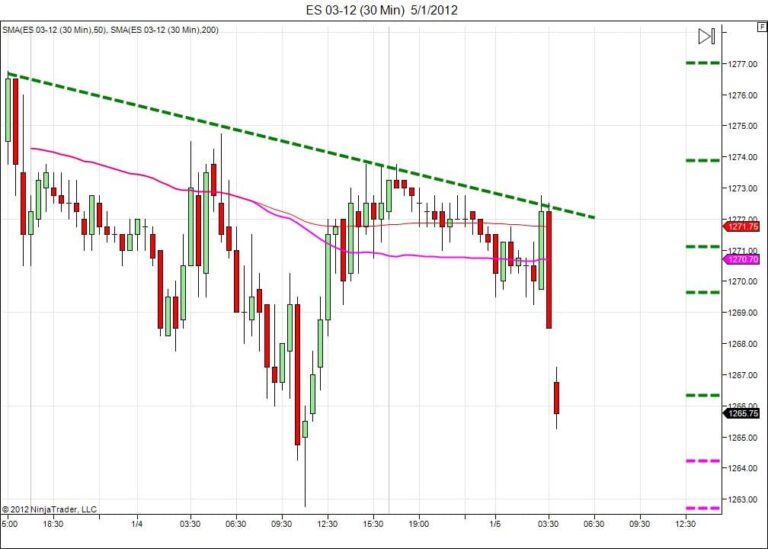
Watching for a mid term double top on the S&P 500 emini futures. seems that we came back up to the previous high with less volume. Presently there is a 48.75 range which is lower than the average.
New to Money Maker Edge? Start here.
Everything on this blog comes from one method: defined risk, a written plan, and live trading with a group. Learn it in three days, then trade it every market day.
The 3-day day trading course · The live trading room · Day trading psychology · Call 866-640-3737