Hourly Charts SPY and QQQ Market recap
Market recap August 23 daily and hourly charts in live trade room.

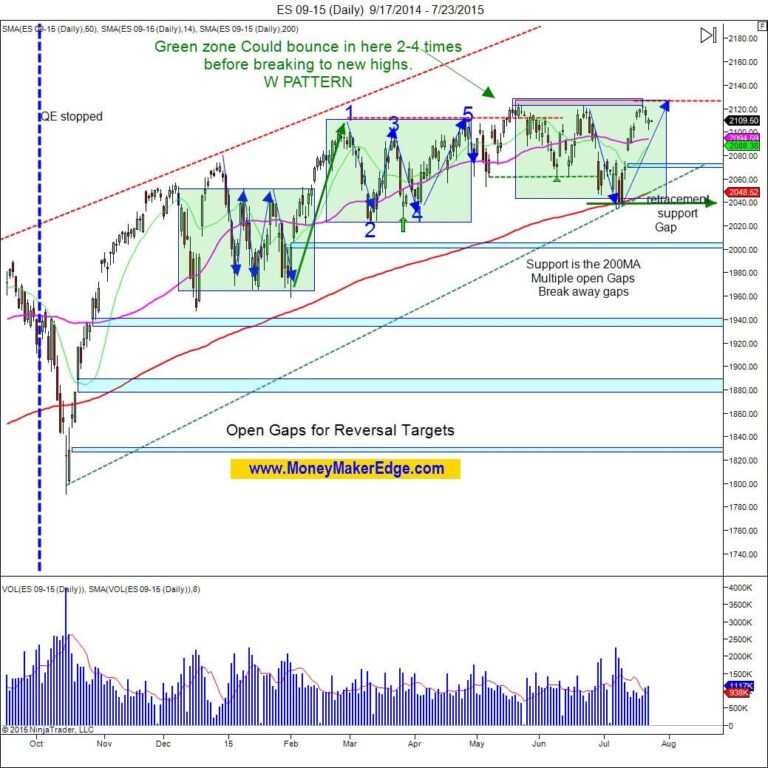
SPY Daily Chart
The chart is showing a repetitive pattern, noted in the boxes, for the top and a pullback on the daily chart for $SPY. Price has broken the bullish trendline and is showing the sellers in control here. In June we had a golden cross where the 50MA crosses the 200MA. Looks like price wants to challenge the 200MA again and maybe a move to previous swing lows.

QQQ Hourly Chart
We see a lower high with a potential for forming a head and shoulders. We are in an uptrend but we are testing the bullish trend line. If we break the trend line, watch for it to go to support and if this doesn’t hold, we could get a move to the previous swing lows.

SPY Hourly Chart
We see a lower high and it looks like it may challenge the support. And if it is broken, look for it to close the gap on the lower support. Take note of the volume of sellers entering the marketplace.
Market recap August 23, not a trade suggestion. Manage your own risk. Never listen to others and if you don’t know what you are doing, consult your investment adviser.
This is what the charts are showing.
Check out our live day trading room.
New to Money Maker Edge? Start here.
Everything on this blog comes from one method: defined risk, a written plan, and live trading with a group. Learn it in three days, then trade it every market day.
The 3-day day trading course · The live trading room · Day trading psychology · Call 866-640-3737